Influencer Engagement Rate: X vs. Threads vs. Instagram
Last updated: June 15, 2026
Which platform delivers the best engagement for influencers? Here's the breakdown:
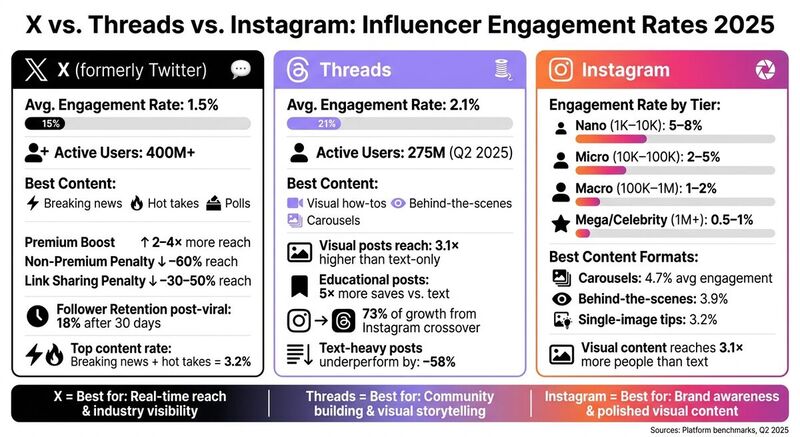
- Threads leads with a 2.1% average engagement rate, benefiting from Instagram's follower crossover and a focus on visual storytelling.
- Instagram varies by influencer size and content type, but nano-influencers (1K-10K followers) see the highest engagement (~5-8%). Visual content like carousels and Reels performs best.
- X (formerly Twitter) averages 1.5%, with verified accounts (via X Premium) enjoying up to 4× more reach. Non-verified users face steep penalties, limiting organic growth.
Key Takeaways:
- Threads thrives on visuals and community building.
- Instagram dominates polished, visually engaging content.
- X suits real-time commentary but struggles with long-term follower retention.
Quick Comparison:
| Platform | Avg. Engagement Rate | Best Content Type | Key Strengths |
|---|---|---|---|
| Threads | 2.1% | Visual storytelling, how-tos | Instagram integration, visuals |
| Varies (5-8% for nano) | Reels, carousels, behind-the-scenes | Polished visuals, brand awareness | |
| X | 1.5% | Breaking news, hot takes | Real-time updates, industry insights |
If you're an influencer, choose based on your content style and audience goals. Threads and Instagram excel at visuals and engagement, while X is better for fast-moving updates and commentary.
How engagement rates are calculated and compared
Engagement Rate Formulas
The go-to formula for calculating influencer engagement is:
Engagement Rate = (Likes + Replies + Shares) ÷ Follower Count
This percentage shows how actively an audience interacts with content in relation to the creator's follower count. It's the standard metric brands and influencers rely on to measure and compare performance.
Some marketers, however, prefer a reach-based formula, where impressions or reach replace follower count. This approach offers a more accurate view, especially on platforms where algorithms limit how many followers see a post. Reach-based rates often reveal a very different picture compared to follower-based ones.
Now, let's dive into how platform-specific factors can change these calculations.
Variables That Affect Platform Comparisons
Even with the same formula, the way platforms operate can lead to wildly different engagement rates.
On X, two key factors shape content success: engagement velocity (how quickly users interact within the first hour of posting) and dwell time (how long someone spends viewing a post). These metrics influence how widely a post gets distributed. Additionally, there's a strong pay-to-play element. Accounts with X Premium verification enjoy a 2-4× boost in distribution [1], while non-verified accounts experience 60% less reach even with the same follower count [1]. Sharing external links? Expect a 30-50% drop in reach [1].
On Threads, visuals dominate. Posts with images or videos perform much better, achieving 3.1× higher reach than text-only posts [1]. The platform also benefits from Instagram's follower graph, giving Instagram users a built-in advantage. In fact, 73% of Threads' growth comes from Instagram follower crossover [1].
Another critical factor is platform maturity. Newer platforms often show higher engagement rates because their active user base tends to be smaller and more niche. Comparing raw engagement percentages from a newer platform to those from an established one can be misleading without considering this context.
Here's a breakdown of how these variables compare between X and Threads:
| Variable | X | Threads |
|---|---|---|
| Primary Reach Driver | Paid verification + velocity | Visuals + Instagram graph |
| Link Sharing | 30-50% reach penalty [1] | Limited visibility |
| Feed Type | Algorithmic (For You) | Algorithmic (Instagram-derived) |
| Follower Retention (post-viral) | 18% beyond 30 days [1] | Tied to Instagram graph stability |
X influencer engagement rates: trends and benchmarks
Average Engagement Rates and Benchmarks on X
The average engagement rate on X sits at 1.5% across all content types [1]. However, certain strategies can significantly outperform this baseline. For example, sharing breaking industry news with sharp commentary tends to achieve around 3.2% engagement. Similarly, engagement bait like polls or provocative questions typically garners 2.8%, while quote-tweet commentary averages 2.4%.
| Content Type | Avg. Engagement Rate |
|---|---|
| Breaking News + Hot Takes | 3.2% |
| Engagement Bait (Polls/Questions) | 2.8% |
| Quote-Tweet Commentary | 2.4% |
| Platform Average | 1.5% |
X Premium can amplify these numbers even further. Verified accounts using Premium enjoy a 2×-4× boost in distribution, while non-Premium users see their reach reduced by as much as 60%. For influencers aiming for organic growth on X, Premium may become part of the distribution budget [1].
"Twitter/X remains essential for industry visibility but organic growth requires Premium ($8-$16/mo)." - Max Beech, Head of Content, Remery
Audience Behavior and Platform Strengths on X
X's real-time nature plays a big role in shaping how audiences engage. The platform thrives on breaking news, quick reactions, and dynamic discussions rather than static, evergreen content. Its algorithm rewards engagement velocity, meaning replies and quote-tweets within the first hour of posting can significantly boost a post's visibility.
Interestingly, only 18% of new followers gained from viral posts remain engaged after 30 days [1]. This highlights how X communities are often loosely connected, forming around trending topics rather than long-term loyalty. This makes the platform especially effective for influencers in sectors like fintech, AI, and crypto, where fast-moving updates dominate.
To make the most of X, aim to post 1-2 times daily, focus on industry-specific commentary, and avoid placing external links directly in your posts. Including links in the main post body can reduce reach by 30-50%. If you need to share a URL, add it in a reply thread instead [1].
The shocking truth about engagement rates | This is how you should measure them instead
Threads Influencer Engagement Rates
Threads currently boasts an average engagement rate of 2.1%, which outpaces X's 1.5% [1]. By Q2 2025, the platform had reached an impressive 275 million active users [1].
Why Threads Sees Higher Engagement Rates
One of the key reasons Threads achieves higher engagement is its integration with Instagram. A significant 73% of its growth comes from creators migrating their Instagram audiences to Threads [1], giving influencers an immediate and loyal following. The platform's algorithm also prioritizes visual content, which naturally performs better than text-based posts. For instance, creators who focus on educational posts - like how-tos or visually engaging listicles - see 5× more saves compared to those relying on text-heavy thought leadership [1]. In contrast, dense and technical writing tends to underperform, with engagement dropping by as much as 58% [1].
Best Practices for Influencers on Threads
To thrive on Threads, influencers should focus on visual storytelling. This could include behind-the-scenes moments, visually appealing productivity tips, or step-by-step guides in carousel format. Shifting from analytical posts to more narrative-driven content can also help maintain audience interest and drive engagement.
Hashtags are another powerful tool on Threads. Strategic use of tags like #StartupLife or #ProductivityHacks can significantly improve discoverability [1]. Additionally, engaging with followers by actively responding to comments boosts engagement, as the platform rewards creators who foster conversations.
For efficiency, influencers can repurpose Instagram Reels or carousel posts for Threads. This allows creators to tap into Threads' visual-first approach without constantly producing new content. These strategies also set up cleaner cross-platform campaigns, which will be explored further in the next section.
Instagram influencer engagement rates: performance by format
Instagram's algorithm gives a clear edge to visual content, meaning creators who lean into images and videos often see better results than those relying on text-heavy posts.
Engagement Benchmarks by Influencer Tier on Instagram
Engagement rates on Instagram shift depending on the size of an influencer's following. Interestingly, smaller accounts tend to have a higher percentage of engaged followers compared to larger accounts.
| Influencer Tier | Follower Range | Average Engagement Rate |
|---|---|---|
| Nano | 1K-10K | ~5%-8% |
| Micro | 10K-100K | ~2%-5% |
| Macro | 100K-1M | ~1%-2% |
| Mega/Celebrity | 1M+ | ~0.5%-1% |
Nano-influencers, despite their smaller audiences, often enjoy more personal connections with their followers, which can lead to stronger engagement and even better conversion rates.
But engagement isn't just about follower count. The type of content shared also plays a big role.
How Different Content Formats Perform on Instagram
Not all Instagram posts perform equally. For example, carousels - popular for step-by-step guides or visual how-tos - average an impressive 4.7% engagement rate [1]. Their swipeable design keeps users interacting longer, often leading to more saves.
Behind-the-scenes posts, like a peek into office culture or creative processes, average around a 3.9% engagement rate [1]. These offer a more personal touch, helping to build trust and deepen community connections.
On the other hand, single-image posts featuring quick tips average about a 3.2% engagement rate [1]. However, text-heavy posts - such as lengthy thought leadership pieces - can see engagement rates drop by as much as 58% compared to visual-first content [1]. This highlights the platform's preference for visually engaging material.
Instagram audiences clearly respond to visuals: research shows visual content reaches 3.1× more people than text-only posts. Educational posts with strong visuals are even more effective, earning 5× more saves than their text-heavy counterparts [1].
The takeaway? Choosing the right format matters just as much as crafting quality content. Carousels educate, behind-the-scenes posts foster trust, and single-image tips provide quick value. This focus on visuals doesn't just boost Instagram engagement - it can also shape strategies for other platforms, amplifying overall influencer success.
X vs. Threads vs. Instagram: cross-platform comparison
Let's dive into how these platforms compare, so you can fine-tune your influencer strategy.
Comparison Table: Engagement Metrics by Platform
| Dimension | X | Threads | |
|---|---|---|---|
| Avg. Engagement Rate | 1.5% [1] | 2.1% [1] | Variable (visual-first) |
| Primary Content | Breaking news, hot takes | Visual how-tos, behind-the-scenes | Reels, carousels, images |
| Algorithm Focus | Paid signals, dwell time [1] | Visual content, leveraging Instagram's social graph [1] | Visual engagement, Reels [1] |
| Link Handling | Suppressed (30-50% reach penalty) [1] | Limited visibility [1] | Restricted to bio and Stories |
| Best For | Industry visibility, real-time commentary | Community building, visual storytelling | Brand awareness, visual content |
X, with over 400 million active users [1], sees an average engagement rate of 1.5%. Threads, boasting 275 million active users [1], edges ahead with a 2.1% engagement rate. Instagram's performance varies based on content type and influencer tier, but visual content consistently delivers strong results. However, X's non-premium accounts face a significant disadvantage, with 60% less reach than verified accounts [1], making organic growth harder without paid promotion. These dynamics highlight how each platform serves a unique purpose, offering a roadmap for crafting tailored cross-platform strategies.
How the Three Platforms Work Together
Using these platforms effectively means playing to their strengths. X works well for breaking news, real-time commentary, and broad visibility. However, it's not the best choice for nurturing tight-knit communities.
Threads and Instagram, on the other hand, shine in community-building. Their audience overlap makes cross-promotion a smart move. For instance, Instagram Reels or carousels can be repurposed for Threads, as both platforms prioritize visual content. That said, technical content tends to fall flat on Threads, underperforming by 58% [1], reinforcing the importance of focusing on visual storytelling for success.
How to optimize influencer campaigns across platforms
How to Track and Measure Engagement Rates
To get the most out of your influencer campaigns, keeping a close eye on engagement rate fluctuations is crucial. One effective way to do this is by using UTM parameters on every link you share. These parameters help you pinpoint which platform is driving the most qualified traffic. For example, running a 30-day experiment with identical UTM-tagged content across X, Threads, and Instagram can reveal surprising performance trends.
On X, focus on tracking replies and quotes within the first 60 minutes to improve visibility. Meanwhile, on Threads, pay attention to saves - educational posts with visuals are saved 5 times more often than text-only posts [1].
This kind of tracking not only helps you understand platform-specific engagement but also lays the groundwork for managing your content more effectively across different networks.
Cross-Platform Posting Workflow with TheBlue.social
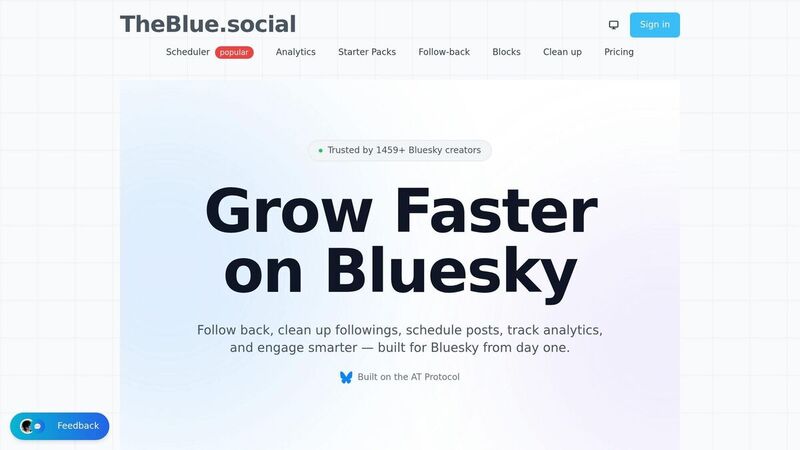
Posting manually on multiple platforms is exhausting. A better workflow is to create the core idea once, then adapt it per network. TheBlue.social helps with that publishing layer: schedule and cross-post to connected accounts across X, Threads, Instagram, Pinterest, LinkedIn, Bluesky, and Mastodon; check link previews; generate alt text; and keep the Bluesky analytics side in view.
The boundary matters. TheBlue.social is not a native influencer analytics replacement for X, Threads, or Instagram. Use each platform's own analytics for engagement rates, reach, saves, and replies. Use TheBlue.social to keep the campaign organized and to measure the Bluesky portion when Bluesky is part of the mix.
To optimize your efforts, consider the 60/30/10 content strategy: dedicate 60% of your energy to your primary platform, 30% to cross-posting on a secondary one, and 10% to ongoing maintenance [1]. TheBlue.social fits the repetitive part of that process: draft, schedule, adapt, preview, and publish. Then pull the performance numbers from each native platform.
And here's a bonus: TheBlue.social offers a free tier - no credit card required [2].
Conclusion: key takeaways for influencers
Each social platform brings something different to the table for your influencer strategy. Recent benchmarks show that X connects you to over 400 million active users. However, non-Premium accounts may see up to 60% less reach, which makes it better suited for sharing news, industry insights, and thought leadership. On the other hand, Threads, with its 275 million users and an average engagement rate of 2.1%, thrives on visual storytelling and educational content. Interestingly, 73% of Threads' growth comes from cross-posting content from Instagram.
The main decision here boils down to reach versus engagement. X offers a broader audience, while Threads provides deeper interaction with your followers. For influencers with a strong Instagram presence, Threads can be a natural extension of your existing audience.
Your content type should guide your platform choice. For example, visual tutorials and lifestyle content perform exceptionally well on Threads, while in-depth technical posts are better suited for X. In fact, text-heavy posts on Threads can underperform by as much as 58% compared to other content formats [1].
To make managing multiple platforms easier, consider cross-posting between platforms. Tools like TheBlue.social let you draft once, adapt per network, schedule posts, preview links, and keep supporting assets like alt text in the same workflow. That is useful admin relief, but still review each post before it goes live. X, Threads, and Instagram each reward different formats.
FAQs
Should I use follower-based or reach-based engagement rate?
Engagement rate based on reach is often the cleaner metric when you want to understand how well your content connects with the people who see it. The formula is straightforward: (total engagements ÷ total reach) × 100. This gives you a clear picture of how effectively your content sparks interaction among viewers.
On the other hand, follower-based metrics are useful for tracking audience growth over time. However, they don't always give an accurate view of how individual posts perform. For a well-rounded analysis, consider using tools that assess both engagement trends and follower growth. This approach can help you fine-tune your strategy and make data-driven decisions.
How can I avoid link reach penalties on X?
On X, including external links in your posts can cut down your reach by 30% to 50%. To sidestep this, avoid adding links directly in your posts. Instead, guide your followers to the link in your bio or consider using a landing page to monitor engagement effectively.
Prioritize crafting posts that drive high engagement. Use X's native analytics for X performance. If Bluesky is part of the campaign, TheBlue.social can help you schedule supporting posts and analyze the Bluesky response.
What should I post on Threads to get more engagement?
To get more interaction on Threads, focus on visual storytelling and sparking meaningful conversations. Posts that include images or videos - think how-to carousels or behind-the-scenes peeks - tend to outperform plain text. These visuals grab attention and keep people scrolling.
Want to encourage replies? Use discussion prompts. Asking open-ended questions or starting debates can invite followers to join the conversation. Timing also matters. Post when your own audience is active instead of copying a generic time slot.
Lastly, consistency is key. Regular posting and sharing tips that people can act on will keep your audience engaged over time.