Ultimate Guide to Hashtag Analytics for Niche Groups
Hashtags are easy to add and easy to overdo. For niche groups, the question is simple: did the tag bring the right people, or did it just decorate the post?
I would track five things:
- Reach: How many unique people saw the post.
- Impressions: How often the post appeared.
- Engagement rate: Whether the audience cared enough to react, reply, save, or share.
- Sentiment: Whether the conversation helped or hurt the topic.
- Post volume: Whether the tag is active, quiet, or too crowded.
Hashtags are NOT dead in 2025 | Good Content ep 46
## Hashtag Analytics BasicsStart with the metrics. Hashtag analytics tools and real-time Bluesky stats can tell you whether a tag is helping, but only if you know what you are looking at.
Key Metrics to Know
Some of the most important metrics to focus on include reach, impressions, engagement rate, sentiment, and post volume.
- Reach shows the number of unique users who saw your content.
- Impressions count every time your content was displayed, even if it was viewed multiple times by the same person [1][3].
If your content has high reach but low impressions, it's attracting new viewers but not holding their attention. On the other hand, high impressions with low reach suggest your content is being repeatedly viewed by the same audience without expanding to new users.
- Engagement rate measures how much your audience interacts with your content. It's calculated as:
(likes + comments + shares + saves) ÷ reach × 100.
For niche groups, engagement matters more than sheer numbers. Sixty meaningful interactions from 500 engaged users are more impactful than 100 interactions from 50,000 passive viewers [3]. Typical engagement rates range from 3-6% (average) to over 10% (exceptional) [3].
- Sentiment analyzes the emotional tone of mentions, categorizing them as positive, neutral, or negative. This is especially valuable for tight-knit communities, where trust and alignment are crucial.
"Regular sentiment analysis can help you proactively address negative feedback and reinforce positive interactions." - EmbedSocial [1]
- Post volume tracks how often a hashtag is used. A hashtag gaining traction quickly signals a trend, while an oversaturated hashtag might make your content harder to find. By monitoring volume, you can jump on trends early while avoiding hashtags that drown out your message.
These metrics work together to show how well your content resonates with your target audience.
| Metric | What It Measures | Why It Matters for Niche Groups |
|---|---|---|
| Reach | Unique users who saw the post | Shows how many new community members you're reaching |
| Impressions | Total times content was displayed | Reveals how often your core audience re-engages |
| Engagement Rate | Interactions relative to reach | The clearest signal of content resonance |
| Sentiment | Emotional tone of mentions | Protects community trust and brand reputation |
| Post Volume | Total hashtag usage | Flags trending topics versus oversaturated ones |
How Niche Groups Benefit from Hashtag Analytics
For niche communities, these metrics act as a listening tool, helping identify key influencers and trends. Two often-overlooked metrics are top contributors and related hashtags.
- Top contributors are users who generate the most engagement around a hashtag. Identifying these individuals can help you find potential collaborators or community leaders already trusted in your space [1][2].
- Related hashtags uncover adjacent audiences. For example, tracking #SourdoughBaking might also reveal #ArtisanBread or #FermentationNation, opening doors to similar but distinct communities [1].
Another valuable insight is geographic distribution. If your hashtag gains traction in a specific region, it's a cue to create localized content or directly engage with that sub-community. For instance, a hashtag like #PDXCycling might resonate with cyclists in Portland, OR, while a generic #Cycling tag appeals to a broader audience [1].
Finally, using multiple relevant hashtags can significantly boost engagement. Posts with 11 or more hashtags can see a 79.5% increase in engagement for accounts with fewer than 1,000 followers [6]. Analytics help pinpoint the hashtags that truly connect with your audience, making this kind of growth possible.
Understanding these basics is the first step toward building a more effective hashtag strategy, which will be explored further in the next sections.
Hashtag Research for Niche Communities
 Finding the right hashtags starts with the tags your target audience uses and watches.
Finding the Right Mix of Hashtags
A great place to start is with the 3-3-3 rule: include 3 broad hashtags (to expand reach), 3 niche hashtags (to connect with specific communities), and 3 branded hashtags (to track and build your brand presence) for each post [1]. This approach keeps your content visible while avoiding an overuse of hashtags that might seem spammy.
"The 3-3-3 rule suggests using 3 broad, 3 niche, and 3 branded hashtags per post to maximize reach, relevance, and brand visibility without looking spammy." - EmbedSocial [1]
The platform changes the tactic. Instagram allows up to 30 hashtags, so a tiered mix can make sense. Bluesky has a 300-character post limit, so I would use 3-5 relevant hashtags at most [4].
| Platform | Recommended Count | Primary Strategy |
|---|---|---|
| 20-30 | Tiered mix (mega, power, niche, micro) | |
| Bluesky | 3-5 | Niche community discovery |
| X (Twitter) | 1-3 | Real-time trends and events |
| 1-3 | Relevance and expertise-driven | |
| 1-2 | Minimal use; focus on Groups |
To find hyper-specific hashtags, use the platform's search tool and assess whether your content can rank in the top posts for that tag. If the competition looks too intense, narrow your focus to a slightly less popular but more achievable tag [2][3]. Once you've nailed down your mix, the next step is to study what's working for your competitors.
Studying Competitor and Influencer Hashtags
Start by identifying key players in your niche - influencers or brands with consistently high engagement. Analyze which hashtags they use in their top-performing posts. Tools like Keyhole (starting at $79/month) and Brand24 (starting at $199/month) can help you track specific hashtags and identify the accounts driving the most interaction around them [1][5].
Look for content clusters: groups of hashtags that appear together and target a specific audience. A fitness account might notice a competitor using #GarageGym, #HomeStrength, and #BarbellTraining together. That points to a focused audience interested in home-based strength training.
Test clusters like this, then track which tags lead to profile visits and follows [3].
"If you're running social campaigns without checking your hashtag analytics, you're flying blind." - Nikola Bojkov, CEO, EmbedSocial [1]
To keep your strategy organized, categorize hashtags into three tiers:
- Proven Winners: Tags that consistently perform well and should be used in most posts (~70%).
- Testing Ground: New or trending tags to experiment with (~20%).
- Retired Tags: Underperforming hashtags that no longer add value.
Regularly rotating and testing hashtags based on competitor insights and performance data ensures your strategy stays fresh and avoids triggering spam filters. This dynamic approach helps you stay ahead and maintain relevance in your niche.
Tools and Data Sources for Hashtag Analytics
Once you have hashtag tiers and competitor clusters, pick tools that answer the questions you have. Most tools fall into three groups: native analytics, social media management tools, and specialized hashtag research tools.
Popular Hashtag Analytics Tools
Native tools like Instagram Insights and X Analytics provide a basic overview, but they come with limitations. For example, they only offer 30 days of historical data and don't break down performance by individual hashtags. While sufficient for quick checks, they're not ideal for building a repeatable, niche-focused strategy.
This is where third-party tools shine. They fill in the gaps left by native platforms with features like deeper analytics and broader tracking capabilities:
- RiteTag ($15/month): Offers real-time hashtag grading using a color-coded system. Green tags are trending, while blue tags are steady evergreen options.
- Keyhole ($79/month): Focuses on campaign-level tracking and predictive analytics, helping you plan future strategies.
- Brand24 ($119/month): Monitors hashtag mentions across multiple sources, including forums and news sites, for a broader view.
- Sprout Social ($249/month): Provides tools for social listening, sentiment analysis, and cross-platform reporting, making it a go-to for complex campaigns.
- BluePilot (price varies): Tailored for Bluesky users, this tool helps navigate the platform's decentralized nature and discover effective hashtags, even with Bluesky's 300-character limit.
For Bluesky users, TheBlue.social is another useful option. It features a free hashtag generator to brainstorm relevant tags and offers analytics tools to track engagement and follower growth.
| Tool | Best For | Starting Price |
|---|---|---|
| RiteTag | Real-time hashtag grading | $15/month |
| Keyhole | Campaign tracking & predictive analytics | $79/month |
| Brand24 | Web-wide mention monitoring | $119/month |
| Sprout Social | Enterprise cross-platform reporting | $249/month |
| BluePilot | Bluesky niche discovery | Varies |
Choosing the right tool is just one part of the equation. You also need to understand the type of data you're working with - real-time or historical - and how each can shape your strategy.
Real-Time vs. Historical Data
Real-time data helps you spot hashtags that are active right now. That matters for live events, launches, and breaking news in your niche.
"Real-time audience insights are the most impactful resource for content strategy." - The 2026 Social Media Content Strategy Report [2]
On the other hand, historical data is all about identifying patterns and proven performers. It shows which hashtags have consistently delivered results, helps uncover seasonal trends, and measures the success of past campaigns. For example, on Instagram, a good rule of thumb is for 20-30% of your total impressions to come from hashtag discovery [3].
The key is to balance both types of data: use real-time insights to adapt quickly during high-activity periods, and rely on historical data to fine-tune your long-term strategy.
How to Read Hashtag Performance Data
Once you have data, read it with your goal in mind. A high-volume tag is not automatically useful. A quiet tag is not automatically bad.
High-Volume vs. High-Value Hashtags
A common mistake in niche marketing is focusing solely on high-volume hashtags. For instance, a tag like #TechTrends might have millions of posts, but your content can quickly get lost in the shuffle. On the other hand, a tag like #DecentralizedSocial may have fewer posts, but it connects you with a highly engaged and relevant audience.
HashtagTools puts the useful signal in plain terms: high engagement means the tag is reaching the audience you meant to reach [3].
The key is to use high-volume hashtags for broader exposure and high-value hashtags for meaningful interactions. Here's a quick comparison:
| High-Volume | High-Value | |
|---|---|---|
| Primary Goal | Reach and awareness | Engagement and conversion |
| Audience | Broad / general | Niche / targeted |
| Competition | Extremely high | Lower, community-focused |
| Key Metric | Impressions / reach | Engagement rate / sentiment |
Striking the right balance between the two ensures you maximize visibility while maintaining relevance. Moving forward, engagement and sentiment metrics can further refine your hashtag choices.
Using Engagement and Sentiment Metrics
Hashtag volume is only part of the picture. Engagement and sentiment metrics offer deeper insights into how well your hashtags resonate with your audience. For niche groups, engagement rate is especially telling. If impressions increase but engagement doesn't, it's a sign the hashtag might not align with your target audience.
Adding sentiment analysis to the mix provides a qualitative perspective. It reveals how people feel about a topic, complementing numerical data with emotional insights [2][5].
The type of engagement also matters. Passive engagement (likes) shows mild interest, while active engagement (shares, replies, saves) indicates that your content is compelling enough to spread or revisit. This is a much stronger indicator of success when building a niche community [2].
"Without analytics, hashtags are just guesses. But with the right data, they become strategic tools for expanding reach, discovering trends, and building stronger audience connections." - Nikola Bojkov, CEO, EmbedSocial [1]
Also watch ranking position. If your posts reach the "Top" section for a tag, visibility can improve quickly. Track which content types and posting times get you there [3].
Building a Hashtag Strategy for Niche Groups
Follow these steps to turn your analytics insights into a practical, repeatable approach for growing your niche community.
Setting Up a Repeatable Framework
Divide your hashtags into three categories:
- Proven Winners: These are your top 10-15 hashtags that consistently generate reach and engagement. Use them in about 70% of your posts.
- Testing Ground: These are new or trending hashtags you're experimenting with, making up roughly 20% of your posts.
- Retired: Hashtags that consistently underperform and should be removed from your strategy. [3]
Within each category, balance industry-specific, niche-focused, and branded hashtags. Build 3-5 hashtag sets for content themes such as education, community highlights, or product updates. Rotate the sets and test new hashtags across 5-10 posts before judging them [3].
"Tracking hashtag performance is the difference between guessing and growing." - HashtagTools.io [3]
Tracking Performance Over Time
Once your framework is in place, regular performance reviews are critical to keeping your strategy effective. Monitoring results over time helps you refine your hashtag categories and sets, ensuring steady growth.
- Weekly Reviews: These quick check-ins help you identify short-term trends, like a hashtag that suddenly gains popularity.
- Monthly Reviews: Use these to make more strategic adjustments to your overall approach. [3]
Remember the 80/20 rule: around 80% of your results often come from just 20% of your hashtags. [3] On Instagram, aim for hashtags to drive 20-30% of your total impressions. If you're consistently below this range, it might be time to rethink your mix. [3]
Every quarter, conduct a deeper audit. Look for hashtags that have become oversaturated, explore emerging niche topics, and A/B test different hashtag combinations on similar posts. This process will help you uncover what resonates most with your audience. [3]
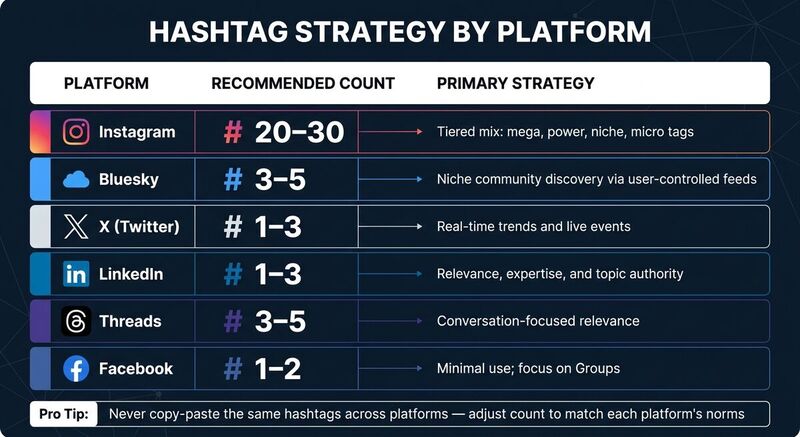
Hashtag Analytics for Bluesky and Cross-Platform Scheduling
Once your hashtag strategy is up and running, the next step is ensuring it works consistently across all the platforms you use. This means extending your approach to track and optimize hashtag performance, not just for Bluesky but for all platforms where you post. To do this effectively, tools to cross-post between platforms and Bluesky-specific analytics become essential.
How Cross-Posting Supports Your Hashtag Strategy
Managing hashtags manually across multiple platforms often creates mistakes. A cross-posting tool like TheBlue.social lets you schedule posts for X, Threads, Instagram, Pinterest, LinkedIn, Bluesky, and Mastodon from one place.
Each platform has its own norms regarding hashtag usage, and sticking to them is key for maintaining your reach:
| Platform | Recommended Hashtag Count | Primary Discovery Driver |
|---|---|---|
| 20-30 | User behavior and interests | |
| Bluesky | 3-5 | User-controlled feeds and hashtags |
| Threads | 3-5 | Conversation-focused relevance |
| X (Twitter) | 1-3 | Real-time conversations and events |
| 2-3 | Relevance, expertise, and topic authority | |
| 1-2 | Content quality and group engagement |
Avoid copying and pasting the same set of hashtags across platforms. Instead, stick to your core niche hashtags but adjust the number to match each platform's expectations. This approach keeps your content consistent while steering clear of spam filters or looking out of place.
Now, let's dive into tools designed specifically for Bluesky to help you turn these cross-platform practices into measurable engagement.
Bluesky-Specific Analytics Tools
Bluesky does not rely on one central feed algorithm to decide what everyone sees. Hashtags, custom feeds, follows, and community behavior all matter. That makes tag choice more visible than it is on some older platforms [4].
TheBlue.social's Bluesky Network Statistics is a handy tool that offers real-time data on engagement trends, follower growth, and overall activity on the platform. These insights help you connect your hashtag strategy directly to your performance.
Bluesky posts are capped at 300 characters and support up to 8 hashtags, so prioritize the ones that add signal.
"Start with a small number of relevant hashtags, typically 2-3 per post, to keep posts natural and avoid a spammy appearance." - BluePilot [4]
If you are unsure which hashtags work on Bluesky, use search to check activity levels. You can also follow the "Trending Tags (Beta)" profile for real-time updates [4]. Bluesky does not have a native "Trending" tab, so manual exploration still matters.
Conclusion
For niche communities, I would rather win a small useful tag than disappear inside a huge one.
Keep a short list of proven tags, a smaller list of tags you are testing, and a retired list you stop using. Review it monthly. Adjust by platform. On Bluesky, keep tags tight because the post limit is short and the community context matters.
TheBlue.social can help with cross-platform scheduling, Bluesky network statistics, and a free hashtag generator when you need more tag ideas.
FAQs
How can I tell which hashtags drive followers or sales?
To find hashtags that lead to more followers or sales, track the tag all the way to the outcome. Reach and impressions are useful, but clicks, follows, conversions, and replies matter more.
Review performance regularly and drop tags that only create vanity metrics.
How long should I test a new hashtag before retiring it?
Give a new hashtag a month, or at least 5-10 posts, before judging it. If it still underperforms after one or two review cycles, retire it or move it back into testing.
How can I track hashtag performance on Bluesky with limited analytics?
Track likes, reposts, replies, follows, and post timing. Then compare those against the hashtags used. For more detail, use TheBlue.social for Bluesky-specific analytics and follower growth trends.
Last updated: June 7, 2026