How to Analyze Bluesky Post Performance
Analyzing your Bluesky posts helps you grow your audience and improve engagement. Start by using Bluesky Analytics to track key metrics like likes, reposts, and follower growth. Here’s a quick summary of what you’ll learn:
Key Metrics to Track: Engagement rates, follower changes, and post reach.
Setting Up Analytics: Link your account to Bluesky Analytics and customize your tracking preferences.
Best Practices: Identify peak posting times, top-performing content, and audience behavior trends.
Improving Strategy: Use data to refine your posting schedule, content type, and overall approach.
Getting Started with Bluesky Analytics
Set Up Your Bluesky Account
To make the most out of Bluesky Analytics, ensure your account is ready to go. Here's what you need:
Your account should be fully verified.
Post some initial content to keep it active.
Make sure your account is public (private accounts have limited analytics features).
Once your account meets these requirements, you're ready to connect it to the analytics tool.
Set Up Analytics Tools
To start tracking your performance, link your Bluesky account to Bluesky Analytics. According to CPFranklin Seal [1], this tool is tailored to meet your analytics needs.
Here’s how to set it up:
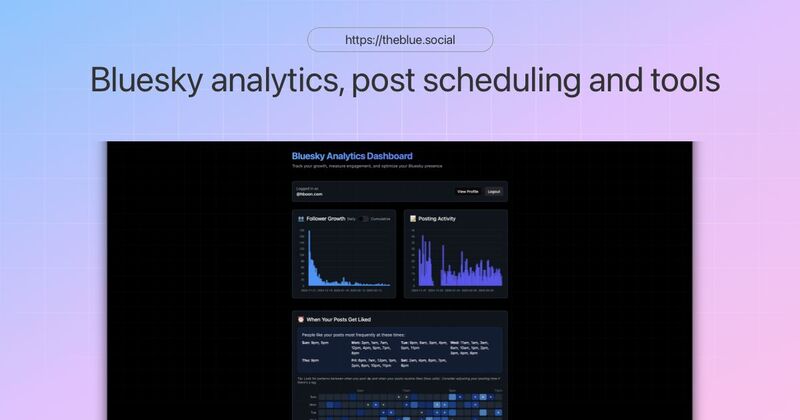
Visit TheBlue.social: Head to the analytics dashboard.
Connect Your Account: Link your Bluesky profile to the tool.
Verify Access: Approve the connection permissions.
Choose Metrics: Select the performance indicators you want to monitor.
Once connected, adjust the access settings to ensure secure and efficient data tracking.
Configure Access Settings
Proper access settings are essential for secure and effective analytics tracking. Here's what you need to do:
Set Up an App-Specific Password
Create a unique password for the analytics tool to keep your account secure while allowing data collection.Enable Permissions
Allow access to track key metrics like:Post engagement
Follower growth
Interaction rates
Scheduling options
Adjust Data Preferences
Customize:How often data updates
Report formats
Notification settings
Privacy options
Bluesky Analytics prioritizes privacy, ensuring your data stays secure while delivering the insights you need.
Understanding Post Performance Metrics
Post Reach
Post reach shows how many unique users see your content on Bluesky.
Here’s what makes up post reach:
Total Impressions: The number of times your post shows up in users' feeds.
Unique Views: The count of individual users who have seen your post.
Feed Position: Where your post appears in users' timelines.
Interaction Numbers
Interaction numbers tell you how users respond to your posts. TheBlue.social's analytics dashboard categorizes these interactions into:
Likes: When users show direct appreciation for your content.
Replies: Comments or discussions sparked by your post.
Reposts: When users share your content with their followers.
Quotes: Shares that include additional commentary from the user.
Interaction Rates
Interaction rates give a clearer picture of how engaged your audience is. These percentages show how many viewers actively interact with your content. Use these formulas to calculate them:
| Metric | Formula |
|---|---|
| Engagement Rate | (Total Interactions ÷ Reach) × 100 |
| Reply Rate | (Replies ÷ Reach) × 100 |
| Repost Rate | (Reposts ÷ Reach) × 100 |
Once you’ve analyzed interactions, take a closer look at how they affect your follower count.
Follower Changes
Track how your posts impact your follower growth. The analytics tool provides insights like:
Net Follower Growth: The difference between new followers and unfollows.
Post Attribution: Identifies which posts contributed to follower growth.
Retention Rate: Measures how many new followers stay engaged over time.
"Extremely grateful, thank you. Such a useful tool! … This helps a lot. There's not another analytics tool out there like yours. theblue.social TheBlue is the TheBest!" - CPFranklin Seal [1]
Next, consider how your posting schedule affects engagement.
Post Schedule Impact
The timing of your posts plays a big role in engagement. Pay attention to:
Peak Activity Hours: Times when your audience is most active.
Days with Highest Engagement: Specific days when your posts perform better.
Posting Frequency: How often you should post to keep your audience engaged.
Time Zone Considerations: Aligning your posting times with where your audience is located.
Use Bluesky Analytics to keep track of these metrics. The tool simplifies data collection, helping you identify trends and fine-tune your posting schedule for better engagement.
Bluesky Analytics & Scheduling Walkthrough
Measuring Post Performance
Let's dive into how to evaluate your post performance using analytics tools. By focusing on key metrics, you can fine-tune your strategy and improve results.
View Analytics Data
Head over to the Bluesky Analytics dashboard to get a detailed look at how your posts are doing. The dashboard offers insights into:
Real-time engagement: See how users are interacting with your posts as it happens.
Historical data: Track performance over time to spot trends.
Audience growth: Monitor how your follower count is changing.
Content breakdowns: Understand how different types of posts perform.
Sort Post Data
Sorting your post data can help you uncover patterns that drive engagement. The analytics dashboard from TheBlue.social allows sorting by:
Date range: Choose from the past 7 days, 30 days, or a custom period.
Engagement type: Filter by likes, replies, reposts, or quotes.
Performance metrics: Focus on reach or interaction rates.
Content type: Separate posts by text, images, or links.
Find Top Posts
Pinpointing your top-performing posts can guide your future content decisions.
1. Access Performance Overview
Go to the performance tab to see posts ranked by engagement metrics.
2. Apply Filters
Narrow down your results by applying filters such as:
Total interactions
Engagement rates
Follower growth impact
Posting time
3. Review Top Posts
Analyze your best-performing posts to identify what works. Look for patterns in:
Content themes
Posting times
Media types (e.g., images or text)
Writing style
Create Data Tables
Organizing your data in tables makes analysis easier and more actionable. Here's an example format:
| Metric | Daily Average | Weekly Trend | Monthly Goal |
|---|---|---|---|
| Reach | Total views tracked | Week-over-week comparison | Growth targets set |
| Engagement | Interaction rates monitored | Peak days identified | Engagement goals set |
| Followers | Daily changes recorded | Weekly growth tracked | Growth objectives set |
Use these tables to track your progress and refine your strategy. The clearer your data, the easier it becomes to plan content that resonates with your audience.
Improving Your Content Strategy
Use the analytics data you've collected to fine-tune every part of your content plan. By focusing on performance metrics, you can adjust and improve your approach effectively.
Best Times to Post
Pinpoint when your audience is most active by analyzing your data. Tools like TheBlue.social's dashboard help you review hourly engagement, day-of-week activity, and follower time zones. Once you've identified peak times, schedule your posts accordingly to maximize visibility.
Best Content Types
To understand what works best, track these key metrics:
| Metric | What to Track | Impact |
|---|---|---|
| Media Type | Performance of images vs. text | Effectiveness of visual content |
| Post Length | Engagement by character count | Ideal message length |
| Topic Categories | Success of different subjects | Audience content preferences |
| Writing Style | Tone and format effectiveness | How well it resonates |
Audience Response Patterns
Keep an eye on:
Engagement Trends: Measure how quickly posts receive likes, replies, or reposts. This helps you understand which content resonates most with your audience.
Follower Behavior: Study how various post types influence follower growth. With tools like Bluesky Analytics, you can directly link follower changes to specific posts.
Regularly review these patterns and make adjustments to maintain strong audience connections.
Track Performance Changes
Monitor these metrics to stay on top of your strategy:
| Metric | Tracking Period | Action Items |
|---|---|---|
| Engagement Rate | Weekly or Monthly | Adjust content variety |
| Follower Growth | Daily or Weekly | Link growth to specific posts |
| Reach Expansion | Monthly | Spot trends in viral content |
| Response Time | Per Post | Fine-tune posting schedule |
Consistently applying these insights will help you identify what’s working and refine your content strategy over time.
Conclusion
Keeping an eye on how your posts perform on Bluesky is key to expanding your audience and building a stronger presence. By focusing on analytics and important metrics, you can create content strategies that drive results and keep your followers engaged.
TheBlue.social's analytics dashboard makes it easier to understand your post performance. With it, you can:
Track how your engagement and follower count are growing
Pinpoint the best times to post for the widest reach
See which types of content your audience connects with most
Observe trends and changes in performance over time
The real value of analysis lies in taking action. Use Bluesky Analytics to dive into your data, tweak your strategy, and stay connected with your community. Regularly reviewing and refining your approach ensures your content continues to hit the mark with your audience.
FAQs
What are the best times to post on Bluesky to boost engagement?
To find the best times to post on Bluesky, use analytics tools to evaluate when your audience is most active and engaged. Reviewing metrics like post reach, impressions, and engagement rates can help identify time patterns that work best for your content.
Tools like TheBlue.social can provide insights into your post performance and follower activity, making it easier to optimize your posting schedule for maximum impact.
What metrics should I focus on to evaluate the performance of my Bluesky posts?
When analyzing the performance of your Bluesky posts, the two key metrics to focus on are reach and engagement.
Reach shows how many people have seen your post, giving you an idea of its visibility.
Engagement measures interactions like likes, replies, and reposts, helping you gauge how well your content resonates with your audience.
By monitoring these metrics, you can better understand what works and refine your content strategy to maximize impact.
How can I use analytics to optimize my Bluesky posts and grow my audience?
To optimize your Bluesky posts and grow your audience, analytics tools can help you track key metrics like reach and engagement. By analyzing how your posts perform, you can identify what resonates most with your audience and refine your content strategy accordingly.
For a more in-depth understanding, you can also track trends in your follower growth and engagement over time. This insight allows you to make data-driven decisions, ensuring your posts consistently align with your audience's preferences and interests.
Last updated: May 2, 2025