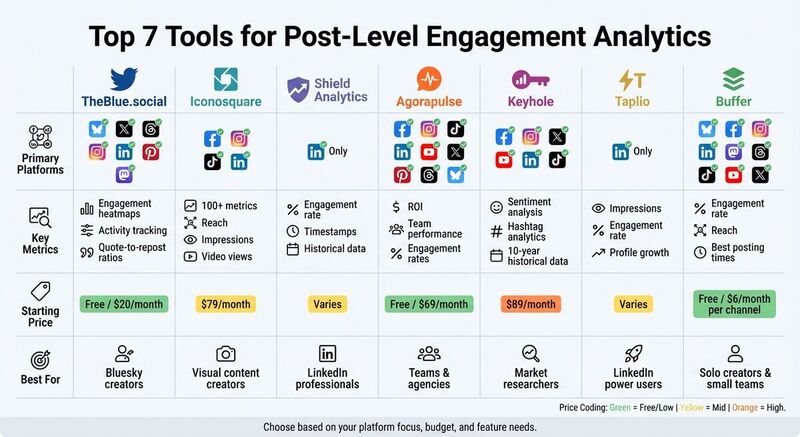
Top 7 Tools for Post-Level Engagement Analytics
Analyzing individual post performance is essential for understanding what resonates with your audience. While many platforms lack detailed analytics, third-party tools can provide actionable insights to optimize your social media strategy. Here are seven tools that excel at post-level engagement analytics:
- TheBlue.social: Ideal for Bluesky users, offering engagement heatmaps, cross-platform scheduling, and AI-driven insights. Free plan available; premium starts at $20/month.
- Iconosquare: Tracks over 100 metrics for Facebook, Instagram, TikTok, and more. Best for agencies and visual content creators. Starts at $79/month.
- Shield Analytics: Focuses on LinkedIn with detailed historical data, timestamp tracking, and engagement insights. Pricing varies.
- Agorapulse: Supports multiple platforms, offering engagement metrics, team performance tracking, and detailed reports. Free plan available; paid plans start at $69/user/month.
- Keyhole: Excels in hashtag analytics, sentiment tracking, and historical data (up to 10 years). Custom pricing; basic plans start at $89/month.
- Taplio: LinkedIn-specific tool for tracking impressions, engagement rates, and profile growth. Pricing varies.
- Buffer: Covers multiple platforms with basic analytics and AI tools for post recommendations. Free plan for 3 channels; paid plans start at $6/month per channel.
These tools cater to different needs, from platform-specific insights to multi-platform management. Choose based on your goals, budget, and preferred features.
Quick Comparison
| Tool | Focus Platform(s) | Key Metrics | Starting Price | Best For |
|---|---|---|---|---|
| TheBlue.social | Bluesky, X, Threads, etc. | Engagement heatmaps, activity | Free/$20/month | Bluesky creators |
| Iconosquare | Facebook, Instagram, TikTok | Reach, impressions, video views | $79/month | Visual content creators |
| Shield | Engagement rate, timestamps | Varies | LinkedIn professionals | |
| Agorapulse | Facebook, Instagram, TikTok, etc. | ROI, team performance | Free/$69/month | Teams and agencies |
| Keyhole | Facebook, Instagram, X, etc. | Sentiment, hashtag analytics | $89/month | Market researchers |
| Taplio | Profile growth, engagement | Varies | LinkedIn power users | |
| Buffer | Multiple (Bluesky, TikTok, etc.) | Engagement, best posting times | Free/$6/month | Solo creators, small teams |
These tools turn raw data into meaningful insights, helping you refine your content strategy and maximize engagement.
Best Social Media Analytics Tools: Perfect For Agencies🤌
## 1\. [TheBlue.social](https://theblue.social/)
TheBlue.social is tailored for creators who need detailed analytics for Bluesky, a platform that currently offers limited built-in tools. It stands out by integrating third-party analytics and enabling cross-posting to X, Threads, Instagram, LinkedIn, Pinterest, and Mastodon. This makes it a handy option for managing content across multiple platforms from a single dashboard.
Post-Level Metrics Tracked
The analytics dashboard provides a clear view of your top-performing posts and overall engagement trends. A heatmap highlights when your followers are most active, and the platform offers best-time recommendations to help you schedule posts for maximum impact. Weekly email summaries provide a quick snapshot of your top posts and engagement stats. As TheBlue.social puts it:
It's like having a personal Bluesky analyst who summarizes your week in a 2-minute read [1].
These insights are particularly useful for refining cross-platform strategies.
Platform Compatibility
While its primary focus is on Bluesky analytics, the cross-posting scheduler lets users publish content simultaneously to X, Threads, Instagram, LinkedIn, Pinterest, and Mastodon. It even supports features like thread merging and quote-skeets. This means you can not only track Bluesky performance but also manage a cohesive multi-platform strategy from one place. Beyond scheduling, the platform includes tools designed to enhance overall engagement.
Key Features
TheBlue.social offers several standout tools:
- AI-generated alt text for images, which boosts accessibility and engagement.
- A Follow-Back tool for quickly reciprocating new followers.
- A Clean Up Followings feature to help manage inactive accounts.
The platform also prioritizes user privacy, explicitly stating that it does not sell user data [1].
Pricing and Value for Professionals or Teams
TheBlue.social has a free forever plan that doesn’t require a credit card [1]. For those looking for more advanced features and higher usage limits, the Early Supporter plan is available for $20/month. This plan also includes priority access to new features and a direct feedback channel for requests. The pricing makes it an appealing option for creators at any stage, offering professional-grade analytics without breaking the bank.
2. Iconosquare
Iconosquare offers in-depth analytics by tracking over 100 metrics to evaluate the performance of both organic and paid posts. This detailed insight is especially helpful for agencies and teams aiming to validate their social media strategies [7].
Post-Level Metrics Tracked
Iconosquare provides insights into engagement, reach, impressions, and community growth at the post level. By analyzing individual posts, users can uncover what content drives the most interaction. This level of detail makes it easier to understand what resonates with your audience, and it complements the platform's broad social media coverage.
Platform Compatibility
The tool integrates smoothly with major social media platforms, including Facebook, Instagram, TikTok, and LinkedIn. It provides robust analytics for these networks, along with social listening tools to monitor hashtags and competitor activities.
Key Features
One of Iconosquare's standout tools is its drag-and-drop dashboard builder, which lets users create personalized workspaces with widgets like graphs, charts, and maps. The report builder is equally flexible, allowing you to add text and images, schedule automatic email delivery of reports, or export them as PNG or CSV files. Agencies can take advantage of the white-labeling feature to add their branding to reports.
Pricing and Value for Professionals or Teams
Iconosquare is priced at a premium, reflecting its advanced features and capabilities. It’s best suited for agencies and established brands that need professional-grade analytics and highly customizable reporting options.
3. Shield Analytics
Shield Analytics is tailored for B2B professionals who often find LinkedIn's native analytics lacking. One of the platform's standout features is its ability to address a common pain point: the absence of detailed historical data and timestamps. Without this information, it’s hard to pinpoint the best times to post and maximize engagement [3].
Post-Level Metrics Tracked
With Shield Analytics, you get a closer look at how your LinkedIn posts are performing. It tracks key engagement metrics like hook effectiveness, ideal post length, and optimal posting times [3]. These insights allow users to identify which types of content resonate most - whether that's text-only updates, visual posts, or a mix of both. By understanding what works, professionals can refine their content strategies and improve their results.
Platform Compatibility
Shield Analytics is built specifically for LinkedIn, making it highly relevant for professionals who use the platform for business development, thought leadership, or recruitment. Unlike generic analytics tools, it zeroes in on LinkedIn’s unique dynamics, offering insights that LinkedIn’s native tools simply don’t provide.
Key Features
The addition of timestamps and historical data is a game-changer. This level of detail helps users identify trends, determine the best times to post, and understand content patterns that drive engagement. It’s a deeper dive into analytics that LinkedIn professionals have been waiting for.
Value for LinkedIn Professionals
While pricing details aren’t specified, Shield Analytics clearly caters to power users who rely on LinkedIn for business growth. Its ability to provide in-depth insights makes it a valuable tool for fine-tuning engagement strategies. With detailed metrics at their fingertips, LinkedIn users can optimize their content and posting schedules with confidence.
4. Agorapulse
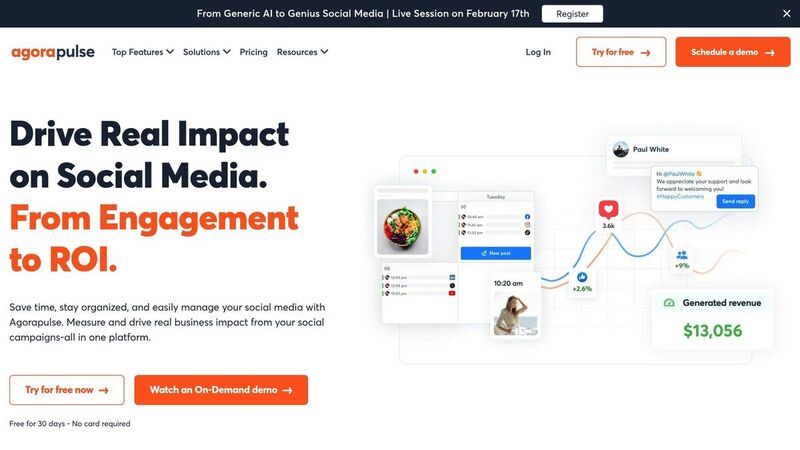
Agorapulse is an analytics platform that supports a wide range of networks, including Facebook, Instagram, LinkedIn, YouTube, TikTok, X, Pinterest, Threads, Bluesky, and Google Business Profile. This extensive compatibility allows for in-depth analytics tailored to each platform's unique needs.
Post-Level Metrics Tracked
Agorapulse monitors a variety of engagement metrics such as reach, clicks, engagement rates, impressions, likes, comments, and shares. For video content, it tracks views, clicks, and autoplay stats. It also offers specialized tracking for Instagram Stories and Reels, along with LinkedIn personal profiles. Instagram analytics include detailed insights into Stories (e.g., reach, completion rates, impressions) and Reels, while LinkedIn users can access reports designed to measure their influence as thought leaders [8].
These metrics give professionals the tools they need to fine-tune their posts for better performance.
Key Features
Agorapulse goes beyond basic analytics with tools designed to simplify content strategy. Its AI-powered Report Digest transforms raw data into actionable insights, recommending the best posting times and content types. For team management, the platform tracks performance metrics like average response times and the number of comments reviewed, hidden, or deleted by team members. Additionally, its label and tag reporting system helps organize content by campaign, with performance data exportable in PDF, CSV, or PowerPoint formats [8].
Pricing and Value for Professionals or Teams
Agorapulse offers a free trial to explore its features, with an optional "Power Reports" add-on available for all plans. These advanced reports allow users to customize metrics across multiple profiles and schedule automated reports for stakeholders. The platform consistently receives positive feedback for its capabilities.
Johanna Hoover from Projected Growth Consulting shares:
The reporting feature is amazing! I love being able to show my clients their growth every month. I love how customizable it is.
Hannah Mullin from Petland adds:
The reporting features support our internal teams' budgetary requests and provide value to our marketing strategies [8].
5. Keyhole
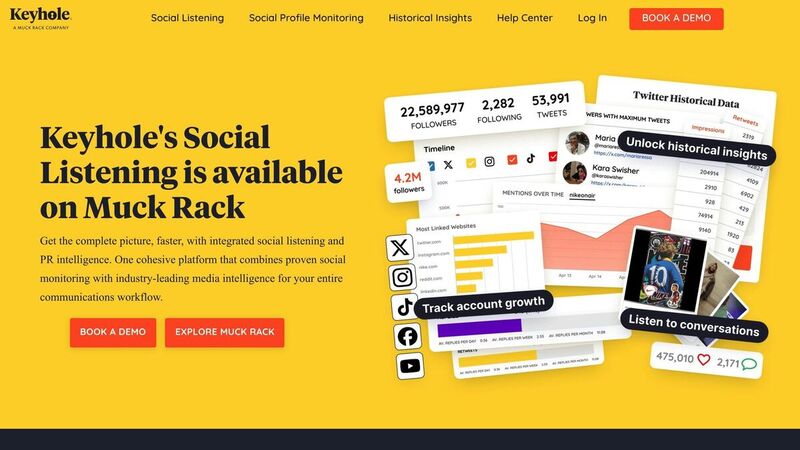
Keyhole is a powerful tool for brands looking to dive deep into market research and historical data analysis. It supports platforms like Facebook, Instagram, X (formerly Twitter), YouTube, LinkedIn, and TikTok, with a particular strength in X analytics - offering data from as far back as a decade ago [3].
Post-Level Metrics Tracked
Keyhole provides insights into post reach, audience engagement, brand mentions, and sentiment [9][10]. One standout feature is its hashtag analytics, which tracks how often specific hashtags are used and identifies the users driving the most engagement. It also measures your "share of voice", showing how your brand stacks up against competitors in your industry [5]. These metrics form the foundation for its more advanced tools.
Key Features
Keyhole’s machine learning system detects emerging trends and monitors real-time audience sentiment [3]. Its social listening tools track live conversations and brand mentions, helping teams address potential reputational issues early [9]. Additionally, its influencer tracking feature analyzes profiles in detail, even spotting fake followers [10]. For reporting, the platform offers customizable dashboards that are presentation-ready, making it easier to showcase social ROI to stakeholders [9][10].
Pricing and Value for Professionals or Teams
The Basic plan starts at $89/month, providing 10,000 social mentions, 5 trackers, and access for 3 users. For more advanced needs, Professional and Enterprise plans are available with custom pricing. Higher tiers include features like competitor benchmarking, unlimited reports, and full API access [9][10]. Historical X data reports start at $50, with costs increasing based on the volume of posts analyzed [3].
Keyhole has earned high praise, with a 4.3/5 rating on G2 from 69 reviews and a perfect 5/5 on Capterra [10]. Users appreciate its detailed reports and effective hashtag tracking but mention that the platform can be challenging to learn and may feel pricey for smaller businesses [10].
6. Taplio
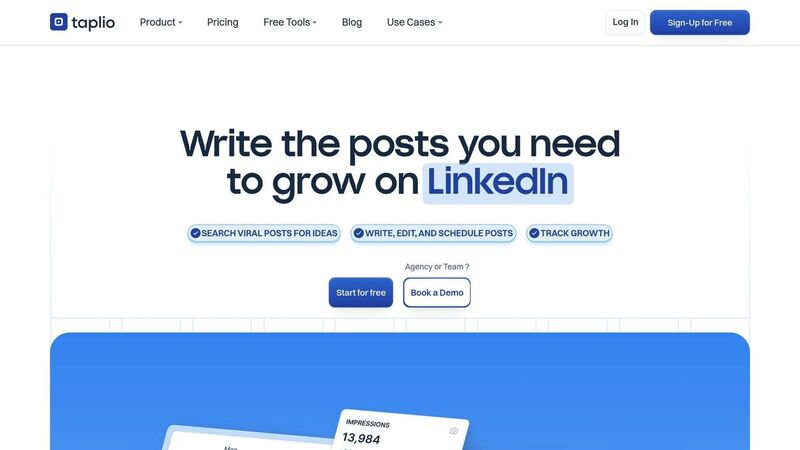
Taplio is a LinkedIn-specific analytics tool designed to enhance professional engagement. Unlike tools that track multiple platforms, Taplio focuses solely on LinkedIn, offering insights tailored to the platform's professional audience.
Platform Compatibility
Taplio is built exclusively for LinkedIn, making it a go-to option for B2B marketers, thought leaders, recruiters, and sales professionals who depend heavily on LinkedIn for networking and business growth. This singular focus allows Taplio to deliver LinkedIn-specific insights that broader tools often miss.
Post-Level Metrics Tracked
Taplio tracks key metrics like likes, comments, shares (reposts), impressions, and views for each post. It also monitors conversion metrics, such as profile visits and follower growth, giving users a clear picture of their content's impact. Additionally, Taplio calculates engagement rates for individual posts, helping users pinpoint the content styles and formats that resonate most with their audience.
Key Features
The tool's AI analyzes your content pillars and suggests the best posting times to maximize visibility. A centralized dashboard provides an overview of multiple metrics, while AI-driven insights reveal which hooks and content formats generate the most engagement. These detailed analytics help users craft data-informed content strategies that drive results.
Pricing and Value for Professionals or Teams
While specific pricing wasn't available, Taplio is designed for LinkedIn power users who need in-depth engagement insights. It’s particularly suited for professionals who rely on LinkedIn to generate business opportunities, rather than casual users looking for general analytics.
7. Buffer
Buffer rounds out our list with its ability to deliver analytics across a wide range of social networks. It supports platforms like Bluesky, Facebook, Instagram, LinkedIn, Mastodon, Pinterest, Threads, TikTok, YouTube, and X (Twitter). This makes it a great choice for teams juggling multiple social media accounts.
Post-Level Metrics Tracked
Buffer monitors essential engagement metrics like likes, comments, shares, clicks, reach, impressions, and engagement rate. It also provides platform-specific insights, such as Instagram Stories' completion rate and average reach, as well as LinkedIn video views. For Facebook and Instagram, Buffer separates organic performance from paid or boosted post data, giving a clear look at what resonates without ad spend.
Platform Compatibility
While Buffer supports publishing to all major platforms, its strongest analytics are available for Instagram (Professional accounts), Facebook Pages, X (Twitter), and LinkedIn Pages. For newer platforms like TikTok, YouTube, and Bluesky, post-level stats are more limited due to API restrictions. Keep in mind that data updates in batches, with delays of up to 24 hours, so real-time tracking isn’t available.
Key Features
Buffer's AI-powered tools enhance productivity by suggesting post ideas, refining drafts, and recommending the best times to post. The Answers tool pinpoints which post types, days, and posting frequencies generate the most engagement. Additionally, you can create custom, branded reports that update daily and can be exported as PDFs or images - perfect for client presentations.
"The efficiency of analytics reporting means that we can take learnings and adapt our future content to reflect those learnings." - Beccy Gibson, Tempt [6]
Pricing and Value for Professionals or Teams
- Free Plan: Covers up to 3 channels, 10 scheduled posts per channel, and basic analytics.
- Essentials Plan: $6/month per channel, includes advanced analytics.
- Team Plan: $12/month per channel, with unlimited users and collaboration tools.
- Agency Plan: $120/month for 10 channels.
All paid plans come with a 14-day free trial. Trusted by over 190,000 creators, small businesses, and marketers, Buffer equips professionals with the tools needed to refine content strategies and boost engagement across multiple platforms.
Tool Comparison Table
Picking the right analytics tool boils down to what you need - whether it’s tracking Bluesky-specific metrics, managing multiple platforms, or diving into historical data. Here’s a breakdown of how seven popular tools compare across key criteria:
| Tool | Primary Post-Level Metrics | Platform Compatibility | Starting Price | Best For |
|---|---|---|---|---|
| TheBlue.social | Follower growth, engagement patterns, activity heatmaps, quote-to-repost ratios | Bluesky, X, Threads, Instagram, LinkedIn, Pinterest, Mastodon | Free Forever plan available; Early Supporter at $20/month | Bluesky creators needing specialized insights like Starter Pack tracking and Follow-Back tools |
| Iconosquare | Reach, impressions, Story completion rates, video views, boosted post detection | Facebook, Instagram, TikTok, X, LinkedIn, Pinterest | $79/month for 1 user and 5 profiles | Visual content creators focusing on Instagram Reels, Stories, and TikTok analytics |
| Shield Analytics | Engagement rate, reach, impressions, clicks, saves | Pricing varies | LinkedIn-focused brands requiring detailed content performance insights | |
| Agorapulse | Engagement, social ROI, team response times, ticket resolution | Facebook, Instagram, TikTok, LinkedIn, YouTube | Free plan available; paid plans start at $69/user/month | Teams tracking both audience engagement and internal productivity metrics |
| Keyhole | Reach potential, sentiment analysis, historical trends (up to 10 years) | Facebook, Instagram, LinkedIn, TikTok, YouTube, X | Custom pricing | Market researchers and brands analyzing long-term trends and sentiment shifts |
| Taplio | Impressions, engagement rate, profile views, connection growth | Pricing varies | LinkedIn creators optimizing professional content and networking strategies | |
| Buffer | Engagement rate, reach, impressions, clicks, best time/day/type to post | Bluesky, Facebook, Instagram, LinkedIn, Mastodon, Pinterest, Threads, TikTok, YouTube, X | Free plan for 3 channels; Essentials at $6/month per channel | Solo creators and small teams managing multiple platforms with simple, actionable insights |
Each tool has its strengths. For example, Buffer supports the widest range of platforms, whereas Taplio focuses entirely on LinkedIn. If Bluesky is your priority, TheBlue.social stands out with metrics tailored specifically for that platform, like quote-to-repost ratios and Follow-Back tools [2][1].
Pricing varies widely. Tools like Buffer and Agorapulse offer free plans, while premium options like Iconosquare start at $79/month. For creators just starting out, TheBlue.social’s free forever plan provides an accessible entry point.
For historical data, Keyhole is a standout. It offers up to 10 years of data for X (formerly Twitter) and includes AI-powered sentiment analysis - perfect for brands looking to track long-term audience reactions or competitive trends [3][5].
Collaboration features differ too. Agorapulse combines engagement metrics with internal productivity tracking, like response times and ticket resolution, making it ideal for agencies managing client relationships [11]. On the other hand, Buffer is all about simplicity, offering AI-powered suggestions for the best times and types of posts without overwhelming users with complex dashboards [3].
Whether you're a solo creator, a team, or a brand, these tools offer a range of solutions to meet your analytics needs.
Conclusion
Using the right tools makes it possible to turn raw data into actionable insights. Post-level engagement analytics take the uncertainty out of social media planning, allowing you to build strategies based on real numbers instead of guesswork. As Alfred Lua from Buffer aptly says, "Data is the fuel that powers a social media strategy." These tools help pinpoint what works - whether it’s a specific hook, caption, or creative format - so you can focus on repeating successes and cutting out what doesn’t resonate.
The best tool for you will depend on your goals. For example, if you’re managing Bluesky, which lacks built-in analytics, platforms like TheBlue.social offer tailored metrics and features like Starter Pack tracking. On the other hand, if you’re juggling multiple platforms, tools with unified dashboards can simplify your workflow by reducing the need to switch between tabs.
To stay on top of your strategy, review your recent posts regularly and dive deeper into the data on a weekly basis to identify trends and effective content elements [4]. Monthly audits focusing on audience demographics and posting recommendations can also help fine-tune your long-term plans without becoming overwhelming.
Whether you’re a solo creator using a free plan or part of an agency tracking hundreds of KPIs, these tools take the guesswork out of social media. The insights you need are already in your data - you just need the right tools to uncover them.
FAQs
What are the most important post metrics for engagement?
The key metrics to track for engagement are engagement rate, reach, impressions, and follower growth. These numbers give you insight into how well your content resonates with your audience and how far it spreads.
How can I find the best time to post using my data?
To figure out the best time to post, start by examining your audience's activity and how they engage with your content. Tools such as Buffer Analyze can pinpoint when your followers are most active, helping you schedule posts during those peak periods.
It’s also a good idea to consistently review analytics from platforms like Buffer Analyze, Postpone, or Viraly. These insights help you adjust your schedule to match high-traffic times, boosting both visibility and engagement.
How often should I review post-level analytics?
Review your post-level analytics on a regular basis - whether weekly or bi-weekly - to identify patterns, fine-tune your posting schedule, and adjust your content strategy. By consistently analyzing this data, you can make informed decisions that boost engagement and enhance the overall performance of your content.
Last updated: February 21, 2026