Top 7 Metrics for Social Media Audience Reporting
Understanding your audience on social media means tracking the right metrics. These numbers go beyond likes and views - they show how your content performs and what changes you need to make. Here's a quick overview of the 7 key metrics every marketer should monitor:
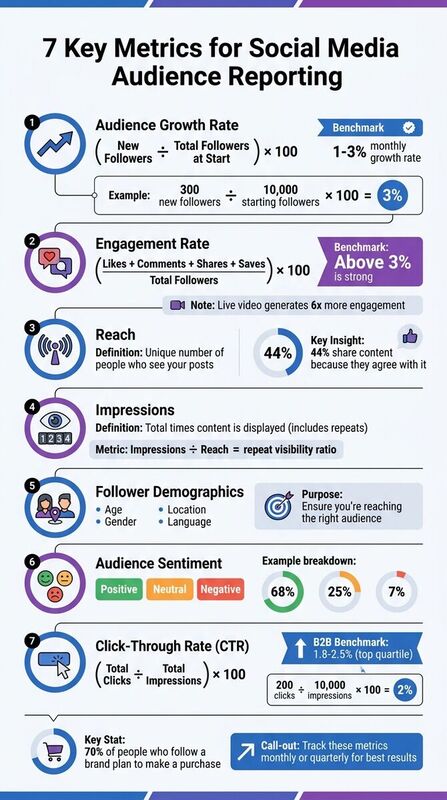
- Audience Growth Rate: Tracks how fast your follower count is increasing. A healthy growth rate is typically 1% to 3% monthly.
- Engagement Rate: Measures how much your audience interacts with your content. An engagement rate above 3% is strong.
- Reach: Counts the unique number of people who see your posts. High reach means your content is spreading effectively.
- Impressions: Tracks how many times your content is displayed, even if seen multiple times by the same person.
- Follower Demographics: Breaks down your audience by age, gender, location, and more to ensure you're reaching the right people.
- Audience Sentiment: Analyzes how people feel about your brand - positive, neutral, or negative.
- Click-Through Rate (CTR): Measures how often people click on your links. A good CTR shows your content drives action.
Why These Metrics Matter
- They reveal what’s working and what’s not.
- They help align your social media efforts with business goals.
- They ensure your audience is engaged and ready to convert.
By tracking these metrics regularly, you can refine your strategy and create content that resonates with your audience.
Top Social Media Metrics to Analyze and How to Measure Them Effectively 📚
1. Audience Growth Rate
Audience Growth Rate measures how quickly your follower count grows compared to your existing audience size. For example, adding 200 followers translates to a 10% increase for an account with 2,000 followers, but only a 1% increase for one with 20,000 followers [2].
Measurement Formula or Calculation
The formula is simple: divide the net number of new followers during a set time frame by your total followers at the start of that period, then multiply by 100. For instance, if you started January with 10,000 followers and ended with 10,300, your growth rate would be:
(300 ÷ 10,000) × 100 = 3% [2].
It’s a good idea to track this metric monthly or quarterly. Platforms like Instagram, Facebook, X (Twitter), LinkedIn, TikTok, and Bluesky all offer built-in analytics tools to help you monitor these changes.
Interpretation and Insights
A growing audience growth rate usually means your content is connecting with people and drawing in fresh followers. Spikes in growth often align with successful campaigns or posts that reach beyond your existing audience. On the other hand, if your growth rate levels off, it might point to content fatigue or challenges with platform algorithms.
"Follower count is often dismissed as a vanity metric. But when evaluated over time as follower growth, it tells a more complete story about your channel's health." - Sprout Social [5]
Be alert to potential red flags. For example, if your follower count increases but engagement doesn’t, it could mean you're attracting an audience that isn’t genuinely interested in your content. Hailley Griffis, Head of Communications and Content at Buffer, noted in early 2026 that consistent posting on Threads was directly tied to steady audience growth and reach, emphasizing the value of regular activity [1].
Platform-Specific Benchmarks
For established accounts, a good monthly growth rate generally falls between 1% and 3% [6]. These benchmarks can help you assess whether your strategy is effective or needs adjustment.
Practical Tips for Improvement
- Focus on creating video content like Reels, TikToks, and Shorts since algorithms currently favor these formats for increasing organic reach.
- Use hashtags thoughtfully to expand visibility and post during times when your audience is most active.
- Engage outside of your own feed by responding to untagged mentions of your brand and participating in relevant industry discussions.
- Collaborate with other creators to tap into their audiences and introduce your content to new communities.
Next, let’s dive into how engagement rate can provide deeper insights into audience interaction.
2. Engagement Rate
Engagement rate is a crucial metric for understanding how well your audience connects with your content. It measures the level of interaction your content generates relative to your follower count. The basic formula is: (Total Likes + Comments + Shares + Saves) ÷ Total Followers × 100 [2] [6]. For a deeper insight into content quality, you can also calculate engagement rate based on reach using (Total Engagements ÷ Total Reach) × 100, which highlights how engaging your content is for those who actually see it [3] [6].
Measurement Formula or Calculation
You can track engagement at different levels - individual posts, campaigns, or entire platforms - to assess how well your content resonates and how effective each channel is [1] [2]. Keep in mind that platforms weigh interactions differently. For instance, Instagram gives more importance to saves and shares via direct messages, while LinkedIn prioritizes thoughtful comments that spark discussions [1]. Using these formulas helps you interpret audience behavior more effectively.
Interpretation and Insights
A high engagement rate is a clear sign that your audience finds your content meaningful [2] [4]. On the flip side, if your reach is high but engagement is low, it could mean your content isn't grabbing attention or encouraging interaction - this might point to weak hooks or irrelevant topics [3]. Different types of engagement also tell their own story: likes show basic approval, comments indicate deeper interest, and shares reflect strong support for your brand [2].
"Keeping engagement rate in mind means I constantly assess visuals and copy and ask 'why would anyone care?'" – Rebecca Broad, Freelance Social Media Marketer [1]
Strong engagement rates not only reflect audience interest but also signal to platform algorithms that your content is worth promoting, often boosting your organic reach [2] [6]. This can have a direct impact on business outcomes - about 70% of people who follow a brand on social media plan to make a purchase in the future [2].
Platform-Specific Benchmarks
Generally, an engagement rate above 3% is considered strong across most industries [6]. Live video content tends to perform even better, generating 6x more engagement than pre-recorded videos [6]. While engagement behaviors vary between communities, steady improvement in this metric is a good indicator that your content strategy is on the right track.
Practical Tips for Improvement
Before posting, ask yourself: "Why would someone stop scrolling and engage with this?" Start by conducting an 80/20 analysis - identify the 20% of your content that drives 80% of your engagement and focus on creating more of that type [6]. On Instagram, prioritize content that encourages shares through direct messages, as these interactions are highly valued [1]. For Threads, stick to a consistent posting schedule since regular activity tends to boost both reach and engagement [1]. On platforms like X (Twitter) and Bluesky, actively participate in replies to spark conversations and include clickable links to drive action [1] [4].
Tagging your content by themes - such as educational, promotional, or behind-the-scenes - can help you pinpoint which types resonate most with your audience [3] [4]. If you notice high reach but low engagement, focus on improving your hooks and calls-to-action to encourage more interaction [3]. Up next, we’ll explore how reach complements these insights.
3. Reach
Reach refers to the total number of unique individuals who have seen your content [1]. Unlike impressions - which count every instance your content appears on a screen - reach focuses on the distinct audience size. For example, if a post has a reach of 15,000, it means 15,000 unique viewers have seen it [1]. This makes reach a crucial metric for understanding how far your brand's message is spreading [3]. Let’s break down how reach is calculated across different platforms.
Measurement Formula or Calculation
Platforms calculate reach by counting unique user IDs that view your content [1]. You can track reach at various levels, such as for individual posts, specific campaigns, or your entire account. Tracking the split between followers and non-followers provides valuable insights into how effectively the platform's algorithm is introducing your content to new audiences [2]. Interestingly, Instagram shifted to "Views" as its main visibility metric across all formats - Reels, Stories, and posts - starting in 2026, streamlining how reach is measured [4].
Interpretation and Insights
A high reach without corresponding engagement often signals missed opportunities to convert views into meaningful interactions [3]. On the other hand, consistent growth in reach indicates a strong and expanding brand presence, while sudden drops might point to issues like poor timing, irrelevant content, or waning interest [3]. A 2024 study revealed that the primary reason people share content - thereby increasing reach - is because they agree with it (44%), followed by finding it informative (29%) or inspirational (24%) [2]. When combined with metrics like engagement and growth rates, reach provides a well-rounded view of your social media performance.
"Different communities and social networks will engage differently, but if you are reaching an increased number of people, then you're doing something right." – Hailley Griffis, Head of Communications and Content, Buffer [1]
Practical Tips for Improvement
To boost reach on Instagram, focus on video formats like Reels, as they tend to perform better with the platform's algorithm [6]. On Threads, posting consistently over time can steadily increase your reach [1]. For platforms like X (formerly Twitter) and Bluesky, including clickable links in your posts can help convert reach into website traffic, especially when you schedule and cross-post across multiple networks. Regularly review your reach metrics and experiment with posting times to align with peak audience activity. Always pair reach with engagement metrics to ensure your visibility leads to meaningful interactions [3]. Next, we’ll dive into how impressions add another layer of understanding to your content’s visibility.
4. Impressions
Impressions track every instance your content is displayed, even if it's shown multiple times to the same person. Unlike reach, which counts unique viewers, impressions count each appearance - so if someone scrolls past your post three times, that's three impressions. This metric gives insight into how often your brand surfaces in feeds and how visible it is overall.
Measurement Formula or Calculation
Most platforms automatically provide impression data through their analytics dashboards. To gauge repeat visibility, divide total impressions by total reach[6]. For instance, a 3:1 ratio means, on average, each viewer sees your content three times. Platforms like X (formerly Twitter), YouTube, and Bluesky focus on impressions, while TikTok uses "total video views" as a comparable metric.
Interpretation and Insights
A higher impression-to-reach ratio indicates that your content is resonating enough to be repeatedly seen, which can strengthen brand recall[3]. However, if impressions are high but engagement is low, it might mean your content is visible but not engaging enough to prompt interaction. A steady rise in impressions could also hint that the platform's algorithm is favoring your posts.
"As a social media marketer, my main focus is top-of-mind relevance. And the amount of times my message and brand is in front of X amount of people (impressions) helps me with that." – Meryoli Arias, Head of Social Media, Glide[1]
Practical Tips for Improvement
- Focus on video formats like Reels and Stories, as platforms often promote these to keep users engaged[4].
- Post during peak activity times to maximize visibility and use targeted hashtags to increase discoverability.
- If your impressions are lagging, revisit your hooks, thumbnails, or posting schedule. Strong hooks can help grab attention and ensure your content doesn't get overlooked by algorithms[3].
- Regularly monitor your impression-to-reach ratio to fine-tune your strategy for better results.
Next, learn how follower demographics can provide deeper insights into your audience.
5. Follower Demographics
Once you've gauged your content's visibility, it’s just as important to understand who is engaging with it. Follower demographics provide a detailed look at your audience, breaking them down by age, gender, location, and language [1][3]. This information helps you determine whether your actual audience aligns with your ideal customer profile - or if your messaging is resonating with an unexpected group. Unlike metrics like follower count, which can be superficial, demographic data offers meaningful context to evaluate the quality of your reach.
Measurement Formula or Calculation
Most platforms offer demographic insights as percentage breakdowns via their analytics tools [1][3]. For instance, you might find that 42% of your followers are aged 25–34 or that 68% are based in the United States [3]. Instagram provides detailed insights, including how impressions and engagement differ between followers and non-followers, as well as when your audience is most active [1]. LinkedIn offers demographic data for individual posts and your overall account, while X (formerly Twitter) limits detailed follower growth and demographic breakdowns to premium accounts [1].
Interpretation and Insights
When your follower demographics closely align with your ideal customer profile, it’s a clear sign that your content strategy is hitting the mark. However, if certain age groups or regions within your target audience are underrepresented, it might be time to create tailored content for those segments [3]. On the flip side, a sudden shift in demographics can signal that new content themes are successfully drawing in fresh audience groups [3]. If your largest demographic segment isn’t engaging as much as expected, it’s worth tweaking your messaging to better appeal to them [3].
Practical Tips for Improvement
- Use geographic data to pinpoint your audience's time zones and schedule posts during their peak activity hours [6].
- Adapt your creative elements - such as tone, visuals, and messaging - to resonate more strongly with the dominant age groups or genders in your audience [1].
- If a specific demographic shows high reach but low engagement, develop content tailored to their interests and preferences [3].
- Leverage the demographic insights from your organic content to fine-tune paid ad targeting, ensuring your budget reaches the most engaged and relevant audience segments [1].
6. Audience Sentiment
Sentiment analysis goes beyond tracking likes, shares, and comments by adding an emotional layer to the data. While engagement metrics measure activity, audience sentiment tells you how people feel about your content. It categorizes reactions and discussions as positive, neutral, or negative, offering a clearer picture of how your brand is perceived. For example, a post with 100,000 engagements might look like a hit - until you discover that most reactions are angry or disappointed. That’s where sentiment analysis becomes critical [3][4].
Measurement Formula or Calculation
Sentiment is usually measured with social listening tools that scan mentions, comments, and reactions to calculate a sentiment score or ratio [3][4]. For small audiences, you can manually review comments, but as your following grows, automated tools become essential [1]. These tools classify mentions as positive, neutral, or negative and provide a breakdown, like 68% positive, 25% neutral, and 7% negative.
Interpretation and Insights
When interpreting sentiment, context matters far more than just numbers. A few strongly negative comments can carry more weight than dozens of neutral mentions [3]. If high engagement comes with mixed or negative sentiment, it may indicate a disconnect in your messaging. On the other hand, a high share of voice paired with positive sentiment can suggest your brand is resonating well with your audience [3].
"Understanding how they feel about them [products] sheds much more light on brand health" - Sprout Social [4]
These insights can guide adjustments to improve audience perception.
Practical Tips for Improvement
- Use social listening tools to track untagged mentions and common misspellings of your brand name, ensuring you capture a complete view of audience sentiment [4].
- Pay close attention to sentiment after major campaigns or product launches to confirm your message is hitting the mark [3].
- Address recurring negative feedback quickly - issues like shipping delays or customer service complaints can escalate if ignored.
- Highlight strong positive feedback by turning it into testimonials or user-generated content to strengthen your brand’s reputation.
- Benchmark your sentiment ratio over time to identify trends and areas where you can improve [3].
These strategies can help you maintain a positive connection with your audience while addressing potential concerns.
7. Click-Through Rate (CTR)
After exploring metrics like growth, engagement, reach, impressions, demographics, and sentiment, CTR stands out as a key indicator of how effectively your content drives action. CTR measures the percentage of users who click on a call-to-action link after viewing your post, making it crucial for understanding how well your content turns visibility into tangible results like website visits, product page views, or landing page traffic[9].
Measurement Formula or Calculation
The formula for calculating CTR is straightforward: (Total Clicks ÷ Total Impressions) × 100. For example, if a post garners 10,000 impressions and 200 clicks, the CTR would be 2%. Most platforms, such as Meta Business Suite or LinkedIn Analytics, automatically track CTR. Additionally, tools like Google Analytics or Bitly can help consolidate this data. However, due to privacy regulations, 20% to 30% of social traffic might appear as unattributed in analytics reports[8][9][10].
Interpretation and Insights
CTR provides valuable insight into how well your content motivates users to act. If your content achieves high reach but a low CTR, it may indicate that while people are seeing your post, it isn’t compelling enough to encourage clicks[3]. Similarly, a high engagement rate (likes, comments, shares) paired with a low CTR often points to issues with the call-to-action or landing page rather than the content itself. This is why CTR is highly regarded by executives - it directly ties content performance to business outcomes[8].
"A low CTR might indicate your audience is seeing your post but isn't inclined to click - your content isn't resonating with them." - Team Asana[11]
Platform-Specific Benchmarks
As of 2026, B2B tech industries can expect CTR benchmarks in the top quartile to range from 1.8% to 2.5%[8]. For example, Facebook ads have an average cost per click of $0.72, which is generally more affordable compared to platforms like LinkedIn, Instagram, or YouTube[4]. Keep in mind that benchmarks vary widely by industry and platform, so it’s essential to research what’s typical for your specific sector[4].
Practical Tips for Improvement
- Use UTM parameters (source, medium, campaign, content) for every link to ensure accurate tracking, even with privacy restrictions[8].
- Monitor CTR daily with real-time dashboards to quickly catch and address any sudden drops[8][10].
- If CTR is underperforming, experiment with A/B testing for CTA buttons, headlines, and visuals to identify what resonates best[11].
- Ensure your landing page matches the promises made in your social post to maintain user interest and reduce bounce rates.
Platform Comparison Table
Social platforms measure metrics differently, which can make it tricky to compare performance across channels. Recognizing these variations is key to setting realistic goals and avoiding mismatched comparisons.
Let’s break down how major platforms track audience engagement. Instagram has shifted to using "Views" as a unified metric for Reels, Stories, and posts, replacing older terms like "Impressions" and "Plays" [4]. This approach counts repeat views in a way similar to impressions on other platforms. Additionally, Instagram offers detailed demographic data for creator and business accounts, including insights on followers versus non-followers [1][4].
X (formerly Twitter) focuses on impressions but lacks a "reach" metric, which means it’s harder to separate total views from unique audience size [4][7]. Advanced analytics on X are mostly reserved for premium users now [1]. However, X stands out for its clickable links within posts, which can lead to better click-through rates compared to Instagram’s reliance on link stickers in Stories or "Link in Bio" options [1].
Bluesky tracks both reach and impressions, offering a clearer picture of audience size [1]. Regular posting is essential for growing reach on the platform, as consistency plays a big role in visibility [1]. While Bluesky doesn’t yet match the advanced sentiment analysis or historical data of older platforms, tools like Bluesky Analytics can help users monitor engagement and follower trends over time.
Here’s a side-by-side look at how these platforms differ:
| Metric | X (Twitter) | Bluesky | |
|---|---|---|---|
| Main Visibility Metric | Views (unified in 2026) [4] | Impressions [4] | Impressions / Reach |
| Reach (Unique Users) | Supported [4] | Not tracked [4] | Supported |
| Clickable Links | Limited (Stories/Bio) [1] | Supported in posts [1] | Supported in posts [1] |
| Engagement Focus | DMs (shares), Saves, Reels [1][6] | Retweets, Replies, Clicks [1] | Likes, Reposts, Replies |
| Video Metrics | Avg. watch time, completion rate, Views [1][4] | Impressions (Reach not tracked) [4] | Basic engagement (likes/reposts) |
This breakdown highlights how each platform approaches engagement and visibility, helping you better assess performance across your social media efforts.
Conclusion
By analyzing growth, engagement, reach, impressions, demographics, sentiment, and CTR, you gain a well-rounded view of your social media performance. These metrics transform social media from guesswork into a structured, data-driven process. As Waqas Ali from ContentStudio explains:
"The key to success lies in viewing social media metrics as a continuous feedback system rather than periodic report cards" [6].
Tracking these metrics consistently allows you to pinpoint what truly connects with your audience. Shifting your focus from vanity metrics - like follower counts - to performance-driven insights reveals the real impact of your efforts, whether that’s driving website traffic, generating leads, or increasing brand awareness. This broader perspective helps you fine-tune your strategy more effectively across all platforms.
To get started, establish a 3-month baseline, adjust your approach weekly using feedback loops, and apply the 80/20 rule to refine your content mix [6]. For teams juggling platforms like Instagram, X, Bluesky, LinkedIn, and Pinterest, tools like TheBlue.social simplify cross-posting and offer Bluesky Analytics to monitor engagement and follower trends in one place. This centralized workflow saves time and ensures consistent performance tracking across channels.
Incorporate these seven metrics into your routine reporting, and you’ll gain actionable insights to sharpen your weekly strategies.
FAQs
How often should I report these metrics?
Tracking social media metrics on a weekly or biweekly basis is a smart move for spotting trends and making adjustments when needed. That said, the perfect reporting frequency really depends on your goals and how active your social channels are. Keeping a close eye on these metrics regularly ensures your strategies remain on point.
What are the key metrics for tracking sales or leads?
Tracking the right metrics is key to understanding how well your content drives sales or leads. The engagement rate, follower growth, and reach are particularly important. These numbers show how well your content resonates with your audience, how effectively it turns followers into customers, and how it motivates actions like inquiries or purchases.
How can I fairly compare metrics across platforms?
When comparing performance across different social media platforms, it’s important to focus on standardized metrics. Key data points like engagement rate, follower growth, reach, and impressions provide a consistent foundation for comparisons. These metrics can be normalized, making it easier to evaluate results across platforms.
To get the most out of your analysis, always align the metrics with your specific objectives. For example, if your goal is audience growth, focus on follower increases. If engagement quality is the priority, pay attention to interaction rates. Also, stick to consistent time frames - like 7 or 30 days - for a fair evaluation.
Finally, remember that each platform has unique features and audience behaviors. Understanding these differences ensures your comparisons are meaningful and rooted in context.
Last updated: May 1, 2026