How to Track Social Media Metrics Across Platforms
Managing multiple social media accounts can feel overwhelming, especially when each platform uses different metrics and reporting tools. A unified analytics dashboard simplifies this process by consolidating data, saving time, and providing a clear view of your performance. Here's what you need to know:
- Why it matters: Tracking metrics across platforms helps you avoid fragmented data, spot trends, and make informed decisions.
- Key metrics to monitor: Focus on engagement (likes, shares, comments), visibility (reach, impressions), and growth (follower increases, traffic).
- How to streamline tracking: Use tools like TheBlue.social to gather all metrics in one place, generate custom reports, and analyze performance efficiently.
Start by identifying which metrics align with your goals, connect your social accounts to a dashboard, and use the insights to refine your strategy. Tools like TheBlue.social make this process smoother, offering real-time updates, customizable reports, and actionable insights for better decision-making.
Mastering Marketing Analytics Across Social, Search, and Web 📱
## Core Metrics to Monitor Across Platforms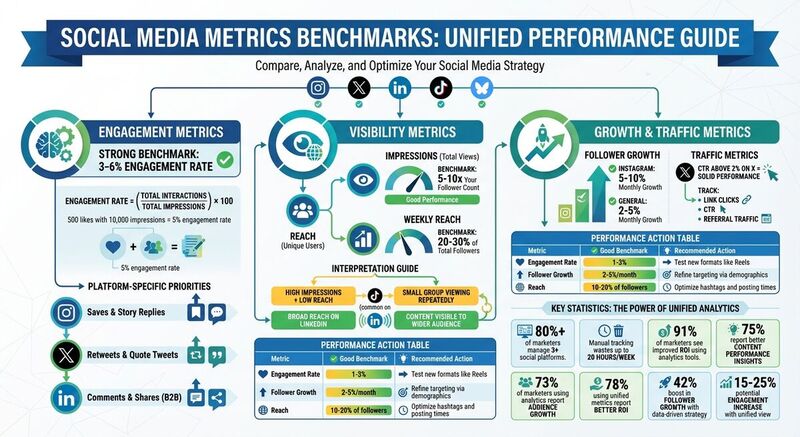 When managing social media, focusing on the right metrics can make all the difference. Instead of getting overwhelmed by data, zero in on the numbers that truly reflect your performance. Let’s break it down.
Engagement Metrics
Engagement metrics are all about how your audience interacts with your content. Think likes, comments, shares, saves, and reactions. For instance, on Instagram, saves are particularly valuable - they show users find your content worth revisiting, which often leads to stronger long-term engagement. Each platform has its own priorities: Instagram values saves and story replies, X (formerly Twitter) highlights retweets and quote tweets, while LinkedIn leans on comments and shares, especially for B2B content.
A good benchmark? An engagement rate between 3-6% is typically strong across platforms. Using a unified dashboard to monitor these numbers can help you refine your strategy and make more informed decisions.
"By looking at the engagement data that is presented, you can optimize your posting time and grow your account." - TheBlue.social [1]
Visibility Metrics
Visibility metrics focus on how many people see your content. Two key figures here are reach (unique users who view your content) and impressions (total views, including multiple views by the same person). These numbers can tell you a lot about your audience. For example:
- High impressions but low reach? This means a small group is repeatedly viewing your content, which is common on algorithm-heavy platforms like TikTok.
- Broad reach on LinkedIn? That’s a sign your content is visible to a wider audience.
As a general rule, aim for impressions that are 5-10 times your follower count and a weekly reach of 20-30% of your total followers. If you notice a sudden drop in these numbers, it could be due to algorithm changes, poor timing, or even restrictions like shadowbans. Keeping an eye on visibility metrics across platforms helps you identify where your content truly shines.
Now, let’s talk about growing and converting your audience.
Follower Growth and Traffic
Follower growth metrics track how your audience evolves over time. Look at net growth (new followers minus unfollows), growth rate (percentage change), and shifts in demographics. For example, if your Instagram grows by 5-10% monthly, it’s a good sign that your content is resonating. On the flip side, stagnation on LinkedIn might mean it’s time to reassess your niche or strategy.
Traffic metrics, such as link clicks, click-through rates (CTR), and referral traffic, connect your social efforts to real-world results. For instance, a CTR above 2% on X is solid. If you’re seeing high CTRs but low conversions, the issue might lie in your sales funnel rather than your social media strategy. Tracking these metrics on a unified platform helps pinpoint where your audience takes action - and where they don’t. [4]
How to Select a Cross-Platform Analytics Tool
Once you've identified the key metrics you want to track, the next step is finding a tool that consolidates them all in one place. With more than 80% of marketers managing three or more social platforms, constantly switching between native analytics tools can waste up to 20 hours each week. A unified dashboard not only saves time but also simplifies strategic decision-making. Here's what to look for in your analytics tool.
Features to Look For
First, make sure the tool integrates with all the platforms you use - whether that's X, Instagram, Threads, LinkedIn, Pinterest, Bluesky, or Mastodon. A centralized dashboard is essential, as it pulls together key metrics like engagement rates, follower growth, and impressions into easy-to-read visual charts. This eliminates the need for manual data compilation and allows you to make direct comparisons across platforms, making your analysis more efficient and actionable.
You'll also want a tool that offers customizable reports with export options like CSV, PDF, or Excel. Real-time data tracking is another must-have, with updates happening multiple times per hour rather than just once a day. Integration with other tools, such as scheduling platforms or CRMs, can further streamline your workflow. Additional perks to look for include automated alerts, historical data comparisons (e.g., 7-day, 30-day, and 90-day views), and mobile access for on-the-go insights. According to the Hootsuite 2024 Social Trends Report, 91% of marketers have seen improved ROI by using social analytics tools, with 75% highlighting better content performance insights as the most significant benefit.
Why Use TheBlue.social
If you're looking for a tool to organize your data effectively, TheBlue.social is a standout option. It supports a wide range of platforms, including X, Threads, Instagram, Pinterest, LinkedIn, Bluesky, and Mastodon, covering both mainstream and decentralized platforms. Beyond the usual analytics, it offers Bluesky-specific features like engagement tracking, follower growth monitoring, and even a one-click follow-back tool. Plus, its real-time data updates multiple times per hour, ensuring you're always working with the latest information.
What sets TheBlue.social apart is its suite of free tools designed to enhance your analytics experience. For instance, you can check if Bluesky is down or verify username availability for rebranding purposes. Additional tools like the hashtag generator, emoji adder, and OG preview tool help optimize your content. Meanwhile, features like network statistics and emoji usage insights provide deeper, niche-level data.
Trusted by over 1,164 active creators, TheBlue.social combines scheduling, analytics, and optimization into one platform that prioritizes privacy - your data is never sold. If you're serious about managing social media efficiently, this tool offers a comprehensive and user-friendly solution.
How to Use TheBlue.social Analytics Dashboard
Set Up Your Account and Connect Profiles
Getting started with TheBlue.social is simple and quick. Head to the website, click "Sign Up", and create an account using your email and a password (minimum of 8 characters, including uppercase and lowercase letters, numbers, and symbols). Once you've signed up, verify your account through the confirmation link sent to your email. Next, select the social platforms you want to monitor - X, Threads, Instagram, Pinterest, LinkedIn, Bluesky, Mastodon - and agree to the terms.
To connect your social accounts, go to "Account Settings > Connected Profiles". For platforms like Instagram, LinkedIn, and X, authorize access via the OAuth login pop-up. For Bluesky and Mastodon, you'll need to generate an app-specific password using TheBlue.social's step-by-step guide. After entering the password, a green checkmark will confirm the connection. Metrics typically sync within 5-10 minutes.
Navigate the Analytics Dashboard
Once logged in, open the "Analytics Dashboard" from the sidebar menu. The "Overview" section provides a snapshot of your performance across all platforms, featuring charts for weekly engagement trends and total follower growth. To dive deeper into individual platforms like X, Instagram, or Bluesky, use the "Platform Breakdown" dropdown. For a more detailed analysis, the "Metrics Deep Dive" tab allows you to filter data by engagement (likes, comments, shares), visibility (impressions, reach), or growth (follower changes).
The dashboard consolidates metrics from all connected accounts and calculates your total engagement rate using the formula: (total interactions / total impressions) × 100. For instance, if a Threads post gets 500 likes with 10,000 impressions, the engagement rate will show as 5%. If this outperforms another post - say, an Instagram Reel with a 2% rate - it will be highlighted in green. Metrics update in real time, and you can view historical data for the last 7, 30, or 90 days, depending on your subscription plan. Use the search bar to filter data by date, and toggle between graph, table, or heatmap views for easy analysis. The "When Posts Get Liked" heatmap is especially helpful for identifying peak audience activity times, so you can schedule posts for maximum engagement.
Once you’ve reviewed your metrics, you can move on to creating custom reports tailored to your goals.
Customize Reports and Automate Exports
In the Reports tab, click "New Report" to create a custom report. Choose the metrics you want to include, such as follower growth or reach, along with the platforms you want to analyze - like Instagram and Bluesky. Select a date range using the calendar picker, with options ranging from the last 7 days to specific periods like Q1 2026. You can also apply filters for post types or hashtags generated with the hashtag tool. Once you’ve set up your report, preview it and save it as a reusable template for future use.
To make things even easier, enable "Auto-Export" in the report settings. This feature lets you schedule daily or weekly emails or save reports directly to Google Drive or Dropbox. Choose from formats like PDF for polished summaries, CSV for detailed data analysis (formatted with commas for thousands and periods for decimals), or PNG for charts you can use in presentations. For team collaboration, share reports via public links with view-only access.
This automation simplifies your workflow - for example, you can receive a Monday morning email summarizing the previous week’s performance across all platforms without any extra effort. If you notice any issues with metrics not updating, refresh your account connections in Settings or use tools like Is Bluesky Down? to check platform status.
How to Interpret Metrics and Improve Your Strategy
Find Your Best-Performing Content
Start by sorting your dashboard by engagement rate to pinpoint posts that resonate most with your audience. These are the posts with the highest interaction relative to their reach. Look for patterns among your top-performing content. For instance, posts featuring engaging questions or short-form videos (usually under 60 seconds) often stand out. TheBlue.social provides detailed analytics, including metrics like likes, replies, reposts, and quotes for each post [1], making it easier to identify what works.
Compare how different types of content perform across platforms. For example, a carousel that thrives on LinkedIn may not have the same impact on Instagram, where short videos tend to dominate. Use the "Most Successful Posts" section to track recurring themes, formats, or posting times that drive engagement. If your engagement rate hits the 1-3% benchmark on Instagram, replicate those elements to maintain consistency.
The "When Posts Get Liked" heatmap is another valuable tool. It shows when your audience is most active, helping you schedule posts during peak activity times. By aligning your content with these high-engagement windows, you can increase visibility and interaction. These insights are key to refining your overall strategy.
Adjust Your Strategy Based on Data
Set clear, measurable goals to guide your strategy. For instance, aim to "increase engagement rate by 15% over the next quarter" instead of settling for vague objectives [4]. Regularly reviewing your metrics is crucial - weekly reviews help you spot and address underperforming posts quickly, while monthly reviews allow you to analyze broader trends and plan upcoming content based on data [4].
Experiment with different content formats to see what resonates. If a post underperforms in terms of reach, consider boosting it or refining your hashtag strategy using the hashtag tool. Keep an eye on follower growth over 7-, 30-, or 90-day periods to assess how specific campaigns influence your audience size [1][2]. According to HubSpot's 2023 data, 73% of marketers who use analytics to tweak their strategies report audience growth [5]. TheBlue.social also offers automated weekly growth reports, summarizing new followers and highlighting top-performing posts [3], so you can stay on track and adjust your approach as needed.
| Metric | Good Benchmark | Action |
|---|---|---|
| Engagement Rate | 1-3% | Test new formats like Reels |
| Follower Growth | 2-5%/month | Refine targeting via demographics |
| Reach | 10-20% of followers | Optimize hashtags and posting times |
Conclusion
Unified metrics are the cornerstone of a solid data-driven strategy. Without them, decisions can easily be based on fragmented information, leading to missed opportunities. By adopting a unified view, you can uncover patterns that might increase engagement by 15–25%. Cross-platform analytics show you what’s working across networks, helping you replicate success and simplify your workflow.
Platforms like TheBlue.social make this process effortless. It consolidates data from X (Twitter), Threads, Instagram, LinkedIn, Pinterest, Bluesky, and Mastodon into a single dashboard. No more juggling multiple tools or manually creating reports. Instead, you get real-time updates on engagement, follower growth, and top-performing content. Weekly growth reports, delivered straight to your inbox, summarize follower gains and highlight your best posts - saving time and helping you plan strategically.
The real game-changer lies in turning data into action. Use heatmaps to pinpoint peak engagement times and adjust your posting schedule. Identify the content formats that drive the most interaction and refine your strategy based on hard data, not assumptions. According to the Sprout Social Index 2025, 78% of marketers using unified metrics report better ROI, with a 42% boost in follower growth [6]. That’s the power of moving from random posting to strategic planning.
Set clear benchmarks, review your metrics regularly, and adapt as the data guides you. Whether your goal is higher engagement, broader reach, or steady follower growth, the insights you need are already within reach. Start unlocking them by connecting your profiles on TheBlue.social today. For more platform-specific tips, explore our Bluesky guides.
FAQs
Which metrics matter most for my goals?
The key metrics to track depend entirely on your social media goals. If your aim is visibility and brand awareness, keep an eye on metrics like reach, impressions, and engagement rates. These will give you a clear picture of how many people are seeing and interacting with your content.
Want to grow your audience? Focus on follower growth and retention rates. These numbers help you understand how well you're attracting and keeping your audience.
To assess how effective your content is, pay attention to likes, comments, shares, and reposts. These interactions reflect how well your posts resonate with your audience.
The bottom line: choose metrics that align with your specific goals - whether it's engagement, audience growth, or reach. This approach will help you fine-tune your strategy and measure success in a meaningful way.
How do I compare metrics across platforms fairly?
To ensure fair comparisons of metrics across platforms, it's essential to rely on standardized KPIs like engagement rates, follower growth, and content reach. Start by setting clear objectives for each platform and consistently monitor these metrics through a centralized dashboard.
Keep in mind that every platform has its own quirks - like differences in audience behavior or preferred post formats. To make comparisons accurate, normalize metrics such as engagement rates by dividing total engagements by the number of followers or impressions.
Using tools like TheBlue.social can make this process much easier and more efficient.
What should I do if my reach or impressions suddenly drop?
If you notice a sudden dip in reach or impressions, it could mean your content isn’t connecting with your audience, or external factors are limiting visibility. Start by reviewing engagement metrics - such as likes, comments, and shares - to spot posts that aren’t performing well. From there, consider tweaking your strategy: try posting at different times, experiment with new content formats, or actively engage with your audience to spark more interaction.
It’s also worth checking if platform-specific issues, like algorithm updates or glitches, might be affecting your visibility. Staying consistent with your posting schedule and aligning your content with when your audience is most active can gradually help regain lost reach.
Last updated: April 6, 2026