Ultimate Guide to Bluesky Post Metrics
Want to grow your Bluesky presence? Start by understanding your post metrics. These metrics reveal how well your content performs and help you refine your strategy. Here's what you need to know:
Key Metrics to Track:
Likes: Shows content appeal.
Reposts: Measures shareability.
Comments: Reflects engagement depth.
Quotes: Indicates meaningful discussions.
Why Metrics Matter:
Spot top-performing posts.
Learn when your audience is most active.
Adjust your content strategy for better results.
Tools to Use: TheBlue.social provides analytics for tracking growth, engagement, and audience trends.
Quick Tip: Post during peak engagement times and experiment with content formats like text, images, or videos to see what resonates most.
Let’s dive deeper into how you can use these insights to improve your Bluesky strategy.
Bluesky Analytics & Scheduling Walkthrough
Core Bluesky Metrics
To measure your content's impact on Bluesky and fine-tune your posting strategy, it's essential to understand the platform's key metrics. Here's a breakdown of what to focus on.
Types of Post Interactions
Bluesky tracks four main interaction types, each reflecting a different aspect of engagement:
| Interaction Type | What It Measures | Why It Matters |
|---|---|---|
| Likes | Quick acknowledgment | Indicates content appeal |
| Reposts | Content sharing | Highlights potential for broader reach |
| Comments | Direct responses | Shows the depth of engagement |
| Quotes | Contextual sharing | Reflects meaningful dialogue and added insights |
A high number of quotes often suggests your content is sparking thoughtful conversations and inspiring users to add their perspectives.
By understanding these interactions, you can analyze when and how your audience engages, allowing you to refine your approach.
Understanding Engagement Data
Beyond interaction types, engagement data provides deeper insights into what drives performance. Pay attention to these key areas:
Time-Based Analysis
Identify the days and times your posts receive the most engagement.
Pinpoint your audience's most active hours to maximize visibility.
Content Performance Indicators
Track engagement rates across various content formats.
Determine which topics encourage more in-depth discussions.
Observe how quickly your posts gain attention after being published.
For a more structured way to monitor these metrics, check out TheBlue.social's analytics platform. It simplifies trend analysis and helps you refine your content strategy for better results.
Metric Analysis Tools
Analyzing Bluesky metrics effectively requires tools that can handle data processing and provide clear visualizations of engagement trends.
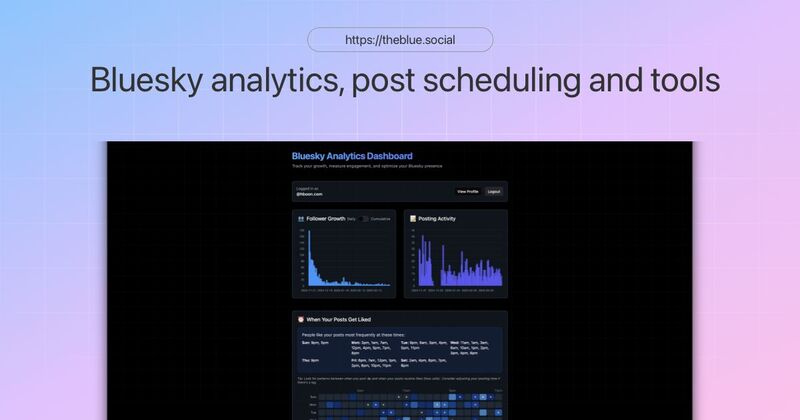
Analytics Platform Features
TheBlue.social analytics platform offers tools to help you track and understand your account's performance. Here's a breakdown of its key features:
| Feature | Purpose | How It Helps |
|---|---|---|
| Growth Tracking | Monitor follower increases over time | Spot trends in audience growth |
| Engagement Analytics | Track likes, reposts, comments, and quotes | Gauge how well your content performs |
| Post Performance | Analyze individual post metrics | Identify which posts resonate most |
| Network Analysis | Review follower-to-following ratios | Build a stronger network strategy |
Data Visualization Methods
Making sense of complex metrics is easier with the right visual tools. TheBlue.social transforms raw numbers into clear, actionable insights through:
Interactive Dashboards
Real-time tracking of engagement metrics
Clear visualizations of performance trends
Audience growth charts
Custom Reports
Compare the performance of different posts
Calculate engagement rates
Analyze trends over specific time periods
These tools simplify data interpretation, helping you create a more effective strategy.
TheBlue.social Analytics Guide
 Make the most of TheBlue.social's analytics features by focusing on these essentials:
Post Tracking
Dive into detailed analytics to understand how your posts are performing and connecting with your audience.
Scheduling Optimization
Use the platform's scheduler to post during peak engagement times for maximum visibility.
Growth Monitoring
Track your account's progress over time with detailed growth metrics.
TheBlue.social combines powerful analytics with a privacy-first approach, ensuring your data stays secure. Use these tools to refine your content strategy and boost your presence on Bluesky. The next section will guide you on applying these insights effectively.
Improving Your Posts with Data
Use analytics to identify your best-performing posts and sharpen your content strategy.
Finding Your Best Posts
To refine your strategy, you need to know which posts perform the best. Here's a quick guide:
| Metric Type | What to Track | Why It Matters |
|---|---|---|
| Engagement Rate | (Likes + Reposts + Replies) ÷ Views | Shows how effective your posts are overall |
| Peak Times | Hours with the most engagement | Helps you post at the best times |
| Content Format | Text, images, links | Reveals which formats your audience prefers |
| Topic Performance | Subject matter categories | Highlights what topics your audience enjoys |
Once you identify these trends, you can adjust your approach to create more engaging content.
Content Refinement Tips
Here are a few ways to improve your future posts:
Timing Optimization: Look at when your top posts were published. Post during those peak times to maximize engagement.
Content Length: Check the character count of your best posts. Use this to determine the ideal length for your audience.
Engagement Patterns: Different types of content drive different interactions. For example:
Posts with questions tend to get more replies.
Visual content like images or videos often earns more likes.
Bold or thought-provoking statements are more likely to be reposted.
Setting Performance Targets
Once you’ve optimized your content and timing, set clear goals to track your progress.
Weekly Growth Goals
Aim for gradual increases in your engagement rate.
Monitor trends in follower growth.
Track improvements in your post reach.
Content Performance Benchmarks
Start by establishing a baseline. For instance, if your average post gets 20 likes, aim to bump that number to 25 likes over the next month. Small, measurable goals can help you stay focused.
Engagement Quality
Don’t just chase numbers - pay attention to meaningful interactions. For example, tracking the ratio of comments to likes can show when your content is truly connecting with your audience. Tools like TheBlue.social’s analytics can make this process easier.
Conclusion
Key Takeaways
Understanding Bluesky post scheduler is essential for crafting content that connects with your audience. Here's a quick breakdown of the main points:
Analytics Basics
Keep an eye on engagement rates to gauge performance.
Find the best times to post for maximum visibility.
Spot patterns in your top-performing content.
Use results to fine-tune your overall strategy.
Using Data to Guide Your Strategy
Let performance data shape your content decisions.
Set realistic growth goals.
Focus on metrics that reflect true engagement.
Make the most of analytics tools to stay on track.
These tips will help you set up and optimize your analytics system while refining your content approach.
How to Begin
Follow these steps to get started:
Set Up Your Analytics
Link your Bluesky account to TheBlue.social to start tracking your metrics.
Establish Your Current Metrics
Analyze your current performance by tracking:
Average likes per post
Reply rates
Repost counts
Engagement trends
Develop a Plan for Improvement
Create a roadmap for enhancing your results:
Timeframe Focus Area Action Steps Week 1-2 Baseline Analysis Record current metrics and identify trends Week 3-4 Content Optimization Adjust posting times and test new formats Week 5-6 Engagement Growth Experiment with fresh content ideas Week 7-8 Performance Review Evaluate results and refine your strategy
With Bluesky's expanding user base, staying on top of your metrics is more crucial than ever. By consistently monitoring and adjusting based on your analytics, you can create content that resonates and fosters deeper engagement.
FAQs
How can I find the best times to post on Bluesky for higher engagement?
To discover the best times to post on Bluesky, analyze your post performance metrics to spot patterns in audience activity and engagement. Look for trends, such as when your followers are most active, and use this data to plan your posts strategically.
By understanding your audience's behavior, you can align your posting schedule to maximize visibility and interaction. Analytics tools can make it easier to track these patterns and adjust your approach over time for better results.
How can I make my Bluesky posts more shareable?
To increase the shareability of your Bluesky posts, focus on crafting content that resonates with your audience. Here are a few strategies to try:
Create engaging visuals: Posts with high-quality images or videos are more likely to catch attention and be shared.
Write compelling captions: Use clear, concise, and relatable language. Adding a touch of humor or asking a question can encourage interaction.
Post at optimal times: Share your content when your audience is most active to maximize visibility and engagement.
Additionally, keeping your posts authentic and relevant to your community will naturally boost their appeal. Experiment with these strategies and monitor your post metrics to see what works best for your audience.
How can TheBlue.social analytics help me track and improve my Bluesky post performance?
TheBlue.social offers powerful analytics tools that help you monitor your Bluesky post performance and follower trends. With these insights, you can identify which posts resonate most with your audience and track engagement over time.
By understanding key metrics like likes, reposts, and follower growth, you can refine your content strategy to maximize impact and build stronger connections with your community.
Last updated: May 7, 2025