How to Use TikTok Analytics for Content Growth
TikTok Analytics is the key to understanding what works for your content. It tracks video performance, audience behavior, and engagement patterns, helping you grow faster and smarter. Creators who check their analytics weekly see a 47% boost in content performance within 90 days and grow their accounts 2.3 times faster. Here's what you'll learn:
- Metrics That Matter: Average watch time, completion rate, traffic sources, and engagement stats (likes, comments, shares, and saves).
- Audience Insights: When your followers are active, their demographics (age, gender, location), and how to tailor content to their preferences.
- How to Access Analytics: Switch to a Creator or Business account, then use TikTok's mobile app or desktop tools for detailed reports.
- Improvement Tips: Post during peak activity, analyze top-performing videos, and refine your strategy based on data.
NEW TikTok Analytics Tools & How To Use Them To Grow Your Business
TikTok Analytics Metrics Explained
 TikTok breaks down your performance data into three main categories: performance indicators (how far your content reaches), audience demographics (who’s engaging with it), and engagement patterns (when and how viewers interact). Each metric provides valuable insights to refine your content strategy.
Main Performance Metrics
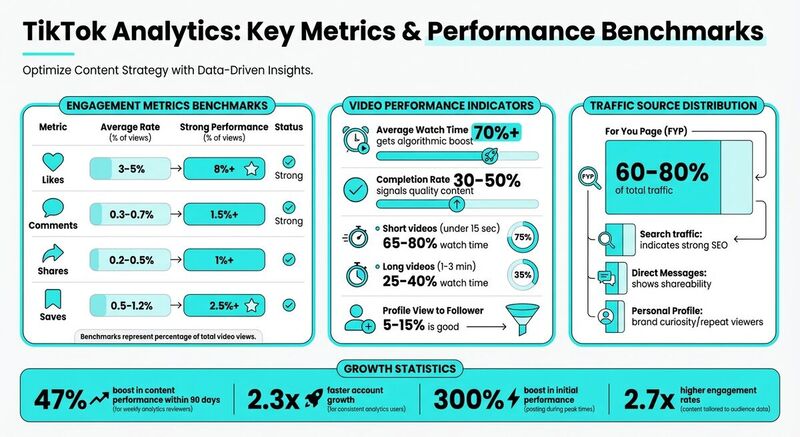
Video Views measure how many times your video has been played, offering a basic sense of reach [5]. However, views alone don’t tell the whole story. That’s where Average Watch Time becomes critical - it tracks how long viewers stick around. TikTok’s algorithm tends to reward videos with an average watch time of over 70% by pushing them to larger audiences [5].
Completion Rate is another key indicator, showing the percentage of viewers who watch your video all the way through. A completion rate between 30–50% signals quality to TikTok’s algorithm, increasing the chances of wider visibility [5]. Keep in mind that shorter videos (under 15 seconds) often achieve higher watch times (65–80%), while longer videos (1–3 minutes) typically average 25–40% [5].
Profile Views provide clues about how many viewers are curious enough to check out your profile after watching a video [5]. If profile views aren’t translating into followers, consider updating your bio, profile picture, or pinned videos to make a stronger impression. A good conversion rate from profile views to followers falls between 5% and 15% [5].
Traffic Sources show where your audience is finding your content - whether it’s the For You Page, Following feed, Profile, Search, Sounds, or external links [5]. A boost in traffic from "Search" indicates that your TikTok SEO strategy is paying off, making your videos discoverable long after their initial posting [5].
Engagement metrics like Likes, Comments, Shares, and Saves reveal how viewers interact with your content. Each type of engagement plays a different role:
- Likes show your content resonates.
- Comments reflect deeper engagement.
- Shares help expand your reach to new audiences.
- Saves indicate your content has lasting value.
Shares are particularly impactful since they actively spread your videos to new viewers [5].
| Metric | Average Rate (% of Views) | Strong Performance |
|---|---|---|
| Likes | 3–5% | 8%+ |
| Comments | 0.3–0.7% | 1.5%+ |
| Shares | 0.2–0.5% | 1%+ |
| Saves | 0.5–1.2% | 2.5%+ |
Audience Demographics
The Followers tab breaks down your audience by gender, age (13–17, 18–24, 25–34, etc.), and top locations (countries and cities) [4][5]. This data helps ensure your content is reaching the right people. For brands with specific targets, matching audience demographics to your market is key [6].
Location data is especially important if you’re monetizing your content. U.S.-based audiences often bring higher CPMs - sometimes 3–5 times more than audiences in regions like Southeast Asia or South America [5]. If your audience is concentrated in different time zones, adjusting your posting schedule to align with their peak activity can lead to better engagement [5].
Understanding your audience’s age and gender also allows you to fine-tune your approach. For example, Gen Z viewers (18–24) may prefer fast-paced edits and trending sounds, while older viewers (35–44) might appreciate slightly longer videos with clear explanations [8][3]. Tracking Follower Growth - the net change in your follower count - can also reveal trends. Spikes often follow viral content, while drops may point to inconsistent posting [5].
Engagement Patterns
Digging into engagement patterns offers even more actionable insights. The Follower Activity graph shows when your followers are most active, broken down by day and time [5]. Posting during these peak periods can boost your video’s initial performance by up to 300% [11]. To maximize visibility, aim to post 30–60 minutes before peak activity [4].
Metrics like Direct Messages highlight when your content sparks conversations, indicating it’s being shared among friends [4]. Meanwhile, high share and save rates suggest your videos are both widely shareable and worth revisiting [12].
Reviewing your Trending Videos in the Content tab can also uncover patterns - like popular audio tracks, ideal video lengths, or trending topics - that consistently drive engagement [4][8]. These insights can guide your next creative decisions, helping you refine your strategy for even better results.
How to Analyze Your Content Performance
TikTok's Content tab is your go-to tool for evaluating how individual videos perform over the past week [1]. This section highlights your Trending Videos, which reveal what resonates most with your audience right now [8][1].
Finding Your Best-Performing Content
Start by pinpointing your top 20% - videos with the highest engagement or shares during a specific timeframe [13]. Look for recurring themes across these top performers: Are there similar hooks, storytelling techniques, or tones that consistently work? For example, in October 2025, the agency Nonsensical analyzed data for their client, Urban Tandoor. Initially, food-centric videos underperformed. After reviewing the numbers, they pivoted to staff-led song parodies. One parody, inspired by East 17, hit 330,000 views, kickstarting a winning formula that eventually generated millions of views [13].
"More than anything, following the videos that do well is a recipe for success on TikTok." - Sam Gillies, Chief Content Officer, Nonsensical [13]
Beyond just views, dig into engagement ratios - likes, comments, and shares as a percentage of total views [5]. Shares are especially critical because they extend your reach beyond your current followers [5]. A share rate of 1% or more indicates strong viral potential, while the average typically falls between 0.2% and 0.5% [5]. Take ClickUp as an example: their top-performing videos featured humorous office scenarios. By tracking hashtags like #corporatehumor and #officehumor, they confirmed this type of content resonated most, allowing them to refine their strategy and focus on relatable, funny posts [13].
Once you've identified your best content, shift your focus to viewer engagement to fine-tune your approach.
Measuring Viewer Engagement
With your top videos in hand, dive into engagement metrics for deeper insights. Two key indicators are average watch time and completion rate [5][4]. Videos with over 70% watch time tend to get broader distribution. Use TikTok's retention graph to spot where viewers drop off [5]. If there's a sharp decline in the first two seconds, your hook might need improvement. A gradual drop-off could point to pacing issues [13][12].
For completion rates, aim for over 50%. This is easier with short videos under 30 seconds but remains an excellent benchmark for 1–3 minute clips as well [5]. Another metric to consider is the views-to-followers ratio - a higher number indicates broader appeal (e.g., 50,000 views with 10,000 followers equals 5 views per follower) [10]. Accounts that consistently monitor these metrics grow 2.3 times faster than those that don't [5].
Tracking Traffic Sources
After reviewing engagement, analyze where your views are coming from to refine your strategy further. A strong For You Page (FYP) performance - where 60% to 80% of traffic originates - is a good sign that TikTok's algorithm is recommending your content to new audiences [5]. If FYP traffic declines, it might be time to revisit your hook, as poor initial retention can limit your video's reach [5].
Traffic from Search indicates that viewers are actively seeking your content or topics, signaling that your TikTok SEO efforts are paying off [5][4]. Use the Search Queries feature (covering the last 90 days) to find the keywords driving traffic to your posts. Then, incorporate these terms into captions and on-screen text to optimize visibility [7]. High traffic from Direct Messages suggests your content is being shared widely [4], while strong Personal Profile traffic reflects either brand curiosity or repeat viewers [4][9].
How to Improve Your TikTok Content Strategy
Using Audience Data to Guide Content
TikTok provides detailed demographic insights, including your audience's gender, age, and top locations. These data points are gold for tailoring your content. For example, if most of your viewers are between 18 and 34 years old, you might want to speed up your editing style and lean into trending topics. On the other hand, if your audience spans multiple time zones, adjust your posting schedule to align with their peak activity hours. A skincare brand in early 2026 did just that, shifting their posting window to 8:00–10:00 PM EST. The result? A 34% increase in average video views over six weeks [9].
Data also shows that content crafted around audience preferences generates engagement rates 2.7 times higher [11]. Use the "Interests" section in TikTok analytics to explore what your followers enjoy beyond your niche. This can help you broaden your content strategy while staying relevant to their tastes.
Once you’ve analyzed your audience data, the next step is experimenting with different content styles to see what resonates most.
Testing Different Content Approaches
Experimentation is key to finding what works on TikTok. Dedicate time each week to test variables like video length, opening hooks, hashtags, and posting times. Keep track of the results with a 20-minute weekly review - log metrics such as views and engagement rates to identify patterns. While trends may take 4-8 weeks to fully emerge, accounts that analyze their data weekly often see a 47% improvement in performance within 90 days [5].
"Analytics turns 'maybe' into measurable proof." - Iris Dawson, Editor in Chief, SocialBoosting [2]
When you discover a format that works, don’t just stick to it - refine it. For instance, if a tutorial-style video generates high engagement, try replicating the format with a fresh topic. You can also use the "Search Queries" section in TikTok analytics to identify terms that brought users to your profile. Incorporating these keywords into your captions and on-screen text improves your visibility and boosts SEO [7].
The insights gained from these experiments will help you set clear, achievable performance goals.
Setting Goals and Tracking Progress
Instead of chasing viral moments, focus on setting measurable goals. For example, aim to increase your average video completion rate by 10% in a month or grow your follower count by 15% [2]. Use TikTok’s platform averages to guide your benchmarks. For mid-sized accounts, a healthy weekly view count ranges from 2 to 10 times the follower count [5]. Additionally, aim for a profile-view-to-follower conversion rate of 5% to 15% [5].
To monitor your engagement rate, use this formula:
(Likes + Comments + Shares + Saves) / Total Views × 100 [8].
Also, pay attention to how many of your views come from the For You Page (FYP). Ideally, 60-80% of views should originate there [5]. If this percentage drops, it’s time to revisit your hooks and pacing to better capture attention.
Tools to Support Your Content Strategy
TikTok's built-in analytics are powerful, but external tools can take your strategy to the next level. Platforms like TheBlue.social offer helpful features to streamline your workflow. Their Free TikTok Username Checker lets you verify handle availability, while their Hashtag Generator helps you find trending hashtags to expand your reach. Additionally, their social media cross-posting scheduler simplifies content management by allowing you to schedule posts across TikTok, Instagram, LinkedIn, and Pinterest - all from one dashboard.
Conclusion
Using TikTok analytics gives creators a clearer path to smarter content creation. The insights reveal which hooks grab attention, which formats spark engagement, and the best times to post - turning random guesses into actionable strategies. Creators who regularly review their analytics grow their accounts 2.3 times faster and see a 47% boost in content performance within 90 days [5].
"TikTok analytics aren't just numbers; they're a map. A map that shows you where you've been, what's working, and where to go next." – Metricool [7]
TikTok and its audience are always evolving. Follower activity changes with the seasons, trending sounds fade in and out, and the algorithm keeps adapting. This isn’t about chasing fleeting viral success - it’s about creating sustainable growth by making data-driven choices.
Pay attention to key metrics like average watch time, completion rate, and traffic sources. For example, if your For You Page percentage drops below 60% or viewers stop watching within the first few seconds, it’s time to tweak your hooks for better engagement [12]. Dedicate just 20 minutes a week to analyze your best and worst-performing content, track audience behavior changes, and experiment with fresh ideas based on the data.
Consistency is the backbone of growth. By using analytics, you can create content that resonates with your audience and aligns with TikTok’s evolving distribution trends.
FAQs
What should I do if my For You Page traffic drops?
If your For You Page traffic takes a hit, TikTok analytics can help you figure out why. Dive into metrics like when your audience is most active, how much engagement your posts are getting, and how individual content pieces are performing. Use this data to tweak your approach - post during peak activity times, experiment with different content styles, or focus on boosting engagement. Keeping a close eye on these insights can help you stay aligned with your audience's preferences and improve your visibility.
How can I use the retention graph to fix drop-offs?
To tackle viewer drop-offs, take advantage of TikTok's retention graph in the analytics dashboard. This tool helps you pinpoint exactly where viewers stop watching your video. Look for spikes in the drop-off rate and review the content at those moments. Are things slowing down? Is the hook weak? These insights can guide your adjustments - whether it's improving pacing, crafting a stronger hook at the start, or making the opening moments more engaging overall. After making changes, keep an eye on the graph to see if your tweaks are keeping viewers around longer. Regular reviews can help you fine-tune your content and hold their attention.
How do I choose 2–3 metrics to focus on each week?
When choosing 2–3 metrics to track each week, focus on those that directly support your objectives. For example, you might monitor engagement (likes, comments, shares), video views, or follower growth. Pay special attention to metrics that reveal trends over time, such as shifts in your weekly engagement rate or follower count. This approach helps pinpoint which content connects best with your audience, allowing you to make informed adjustments to refine your strategy.
Last updated: March 20, 2026