A/B Testing Instagram Post Timing: Best Practices
Last updated: August 14, 2026
There is no universal best time to post on Instagram. Your followers have their own locations and habits, and a time slot that works for a weekday Reel may do nothing for a weekend carousel.
Run a small timing test instead. Keep the content format and topic comparable, change the posting time, and use Instagram Insights to decide whether the difference is worth keeping.
Start with Instagram Insights
Instagram says Insights are free for business and creator accounts. The account view includes reach, interactions, and follower trends. Accounts with at least 100 followers can also see follower locations and the times their followers are most active.
Open Professional dashboard → Insights → Total followers and write down two plausible time windows. Do not begin with a generic "best time" chart unless your own account has too little history. Your followers are the group you are trying to reach.
Use the individual post and Reel views for the comparison. Instagram defines accounts reached as unique accounts that saw the content, while views may count repeat plays or displays. Interactions include actions such as likes, comments, saves, and shares. Those definitions matter when you copy the numbers into a spreadsheet.
Instagram notes that some Insights metrics are estimated and still in development. Treat a small difference as noise, not a new rule.
Instagram's official Insights guide lists the current metrics and eligibility details.
Pick one question
A useful timing test asks one narrow question:
- Does a Tuesday post perform better at 9 a.m. or 6 p.m. for this account?
- Do weekday Reels reach more non-followers at lunchtime or in the evening?
- Do Saturday carousels earn more saves in the morning or late afternoon?
Choose the primary metric before publishing. Use reach when the goal is distribution, saves when the post is meant to be kept, and website sessions or sign-ups when the post is supposed to drive an action.
Avoid a vague goal such as "more engagement." A post can earn more likes but fewer saves and fewer site visits. Without a primary metric, it is too easy to choose the number that makes the preferred time look better.
Keep the posts comparable
Do not publish an identical post twice in a row. Followers who saw the first copy may ignore the second, and the repeated creative can become the main difference between the two posts.
Use matched posts instead:
- Keep the format the same: compare Reel with Reel or carousel with carousel.
- Cover topics with similar audience appeal.
- Use a similar call to action.
- Keep the day of the week fixed when testing the hour.
- Avoid holidays, launches, collaborations, and paid promotion during the test.
For example, compare two short product-tip Reels on consecutive Tuesdays. Publish one at 9 a.m. and the next at 6 p.m. Then swap the order for another pair. Alternating the time helps prevent one unusually strong week from deciding the test.
Schedule a simple four-post test
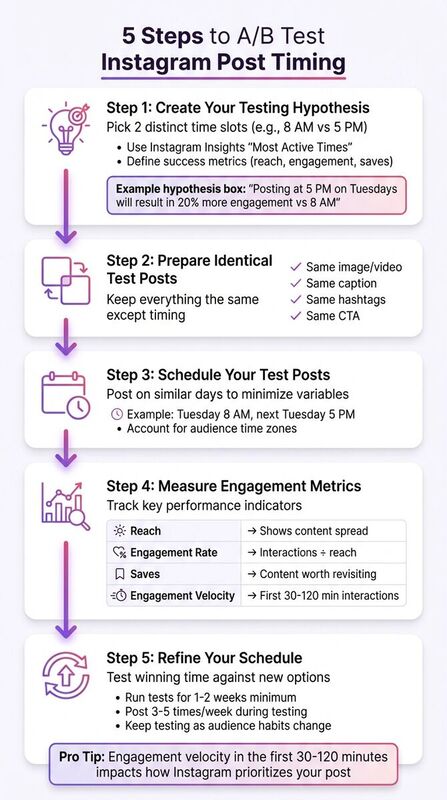
Four matched posts are enough for a first pass:
| Post | Day | Time | Format |
|---|---|---|---|
| A1 | Tuesday | 9 a.m. | Reel |
| B1 | Tuesday | 6 p.m. | Reel |
| B2 | Tuesday | 6 p.m. | Reel |
| A2 | Tuesday | 9 a.m. | Reel |
Schedule the posts in advance so a busy day does not push a morning post 37 minutes late. TheBlue.social's scheduler can publish Instagram posts at the times you choose. It does not replace Instagram Insights or calculate an Instagram A/B-test winner; check the Instagram metrics after each post has had the same amount of time to collect views and interactions.
The same timing grid can be used for other networks connected to TheBlue, but evaluate each network separately. A strong Instagram slot says nothing about when the same audience checks Bluesky, Threads, or LinkedIn.
Record the numbers at the same age
Check every post after the same interval, such as 24 hours and again after seven days. Comparing a two-hour-old post with a three-day-old post makes the table useless.
Track only the fields needed for the decision:
| Field | Why keep it |
|---|---|
| Accounts reached | Compares unique distribution |
| Views | Useful for Reels, but may include repeat views |
| Interactions | Shows the total response to the post |
| Saves and shares | Useful for posts meant to be kept or passed on |
| Profile or website action | Connects timing to the intended next step |
Add a note for anything unusual: a collaborator shared the post, the topic appeared in the news, or the account ran a promotion. Do not quietly fold an outlier into the average.
For rates, divide by the same denominator throughout the test. Interactions divided by accounts reached is usually easier to compare than interactions divided by follower count, because reach can vary widely from post to post.
Keep the raw counts beside the rate. A 20% interaction rate from 20 reached accounts means four interactions; an 8% rate from 2,000 reached accounts means 160. The rate answers how strongly the reached audience responded. The count answers how much activity the post produced.
You can use a plain spreadsheet with one row per post. Add columns for publish time, format, topic, the 24-hour reading, the seven-day reading, and any unusual event. A separate notes column is more useful than trying to encode every difference in the file name.
Decide whether the difference is useful
Four posts can show a direction worth testing again. Check whether both posts in one time slot beat both posts in the other on the primary metric. Then look at the size of the difference.
If 6 p.m. wins by 2%, keep testing. If it repeatedly wins by 25% and the posts were comparable, use 6 p.m. for the next batch and revisit the test later.
A losing time can still be useful. It may reach a different region, produce more replies, or fit the hours when you are available to answer comments. Keep the schedule that supports the job of the account, not just the largest number in the table.
Also check whether the preferred slot is practical. If 6 p.m. performs better but nobody can answer product questions until the next morning, a slightly weaker daytime slot may produce better conversations. Scheduling solves the publishing time; it does not cover the replies that follow.
Common timing-test mistakes
Changing the creative and the time
A video compared with a static image tests format and timing together. You will not know which change mattered.
Testing one post per slot
One post can win because of its subject, hook, or random variation. Run at least two matched pairs before changing the normal schedule.
Comparing different measurement windows
Take each reading after the same number of hours or days. Keep the later reading separate rather than overwriting the first one.
Treating follower activity as a guarantee
The "most active times" chart is a good starting point. It does not guarantee reach, and it does not account for the quality or subject of a post.
Claiming that timing caused every difference
Organic posts are not a laboratory experiment. The test reduces obvious variables, but it cannot hold the feed, competing posts, or audience mood constant. Use repeated patterns, not one lucky post.
Pick two time slots from Instagram Insights, schedule four comparable posts, and record each post after 24 hours and seven days. If the same slot wins both matched pairs by a useful margin, use it for the next month. Then test again when the audience, content mix, or time zone distribution changes.