Facebook Engagement Metrics: Ultimate Guide
Want to boost your Facebook presence? Engagement metrics are the key to understanding how your audience interacts with your content. From likes and shares to comments and clicks, these metrics reveal what works - and what doesn’t. The higher your engagement, the more Facebook’s algorithm will prioritize your posts, increasing visibility.
Here’s what you need to know:
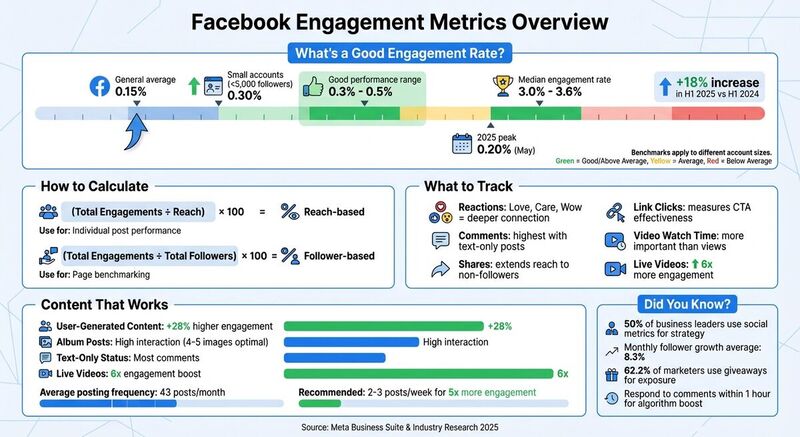
- Engagement rate measures interactions as a percentage of your audience. Aim for 0.3%-0.5% for smaller accounts (under 5,000 followers).
- Reactions like "Love", "Care", and "Wow" show emotional connections, while "Angry" or "Sad" may signal issues.
- Clicks and video metrics (like average watch time) highlight interest and effectiveness.
- Content types matter: Albums and user-generated posts often outperform polished content.
- Timing is critical - posting when your audience is most active maximizes engagement.
Tracking these metrics using tools like Meta Business Suite can help you refine your strategy, identify trends, and connect with your audience. Let’s dive into how to measure, analyze, and improve your performance.
Core Facebook Engagement Metrics
Engagement and Engagement Rate
When we talk about total engagement on Facebook, we're looking at every action users take beyond simply scrolling past your content. This includes reactions, comments, shares, link clicks, photo views, and video plays - essentially, any way someone interacts with your post [1][2].
The engagement rate adds context to these raw numbers by converting them into a percentage. There are two main ways to calculate it:
- Reach-based formula: Divide total engagements by reach, then multiply by 100. This tells you how many people who saw your content actually engaged with it [2][4].
- Follower-based formula: Divide total engagements by total followers, then multiply by 100. This gauges how active your community is [2][10].
Most brands hover around an engagement rate of 0.15%, but smaller accounts (under 5,000 followers) often achieve closer to 0.30% [8]. If you’re hitting between 0.3% and 0.5%, you’re doing better than average [3]. Use the reach-based formula to evaluate individual posts and the follower-based formula to benchmark your page against competitors who don’t share their reach data [10][3].
Now, let’s dive into how reactions can reveal your audience’s emotional connection to your content.
Reactions and What They Mean
Facebook reactions go beyond the simple "Like" and include Love, Care, Haha, Wow, Sad, and Angry [2]. Each of these reactions offers insight into how your audience feels about your content.
A "Like" is a basic acknowledgment, but Love, Care, and Wow reactions suggest a deeper emotional connection [9]. For example, when someone chooses "Love" instead of "Like", it shows your content struck a stronger chord.
On the other hand, Haha reflects humor or lightheartedness, while Sad and Angry reactions can signal trouble. For instance, if a product launch post gets a wave of "Angry" reactions, it’s worth investigating - perhaps the pricing didn’t land well, or the messaging was off.
"Sentiment tells you whether you're actually connecting. Are people reacting emotionally? Are the comments thoughtful or curious or confused and off-target?"
Don’t just tally up reactions - dig into the sentiment behind them. High engagement numbers mean little if the audience’s emotional response is negative. By analyzing patterns in reactions, you can fine-tune your messaging to better align with your audience's expectations and emotions.
Next, let’s look at how clicks and video metrics provide even deeper insights into engagement.
Clicks and Video Metrics
Link clicks measure how many people followed your call-to-action to an external site, showing how effective your messaging is at driving action [2][9]. Meanwhile, photo views track how often users expand an image, signaling that your content piqued their curiosity enough to explore further.
For video content, Facebook offers several key metrics. 3-second views are the minimum threshold for a "view", while 10-second views indicate stronger interest [2][9]. However, the most telling metric is average watch time, which reveals how long viewers stayed engaged. If most viewers drop off after just a few seconds, your opening might need more impact. On the flip side, sustained watch times suggest your pacing and content are on point.
Live videos are a standout format, generating 6x more engagement than standard uploads. They’re a powerful way to connect with your audience in real time [2]. By monitoring drop-off points in your video analytics, you can identify where viewers lose interest and refine your hooks and pacing for future videos [6].
Engagement Metrics by Content Type
Page and Post Engagement
Not all Facebook content performs equally. Album posts tend to stand out because multiple images encourage users to interact more[3]. For instance, if you’re announcing a product launch or sharing a behind-the-scenes moment, posting a series of 4–5 images can create more buzz than a single photo.
Text-only status updates, surprisingly, generate the highest number of comments[8]. These posts naturally spark conversations, making them perfect for discussion topics. Additionally, user-generated content (UGC) often sees about 28% higher engagement compared to polished branded posts. Why? People connect more with its relatable and authentic vibe[3].
When analyzing Page performance, focus on key metrics like reactions, comments, shares, and link clicks. Shares are especially valuable since they extend your content’s reach to non-followers, proving its relevance. However, if your content gets plenty of reactions but few shares, it might mean that while people find it entertaining, it’s not impactful enough to share.
Now let’s dig into how videos perform and what metrics matter most for this format.
Video Engagement
When it comes to video content, viewer retention is far more telling than view counts. Facebook considers a "view" after just 3 seconds[2], but this doesn’t necessarily indicate genuine interest. Average watch time, on the other hand, gives a clearer picture - if viewers are dropping off quickly, it’s time to rethink your opening[5].
Live videos, in particular, get special treatment in Facebook’s algorithm. They’re prioritized in news feeds and even trigger push notifications to followers, leading to faster engagement and longer watch times. Hosting live Q&A sessions or making real-time announcements can help you take advantage of this boost[3].
To refine your video strategy, examine your retention chart. It shows exactly where viewers lose interest, offering clues about whether your content is too long or needs a more engaging format.
Facebook Groups and Ads
Facebook Groups and Ads require different approaches when it comes to measuring engagement.
In Groups, success isn’t about reach like it is on Pages. Instead, it’s all about active members - those who post, comment, or react within a 30-day period[4][5]. A large membership number doesn’t mean much if only a small percentage of members are active. Tracking top contributors can help you identify and nurture engagement within the community.
For Ads, efficiency is the name of the game. Metrics like Click-Through Rate (CTR) reveal how appealing your ad creative is, while Cost Per Click (CPC) and Cost Per Action (CPA) show how effectively you’re spending your budget[5][4]. For example, a high CTR but low conversions could point to issues with your landing page.
Another key factor is Ad Frequency. If the same person sees your ad too many times, they may experience "ad fatigue", which lowers engagement and increases costs[1]. This is especially crucial for smaller audience segments where repetition happens faster.
| Metric | What It Measures | When to Use It |
|---|---|---|
| CTR (Click-Through Rate) | Clicks ÷ Impressions | Assess how engaging your ad creative is[5] |
| CPC (Cost Per Click) | Total Spend ÷ Total Clicks | Evaluate how much you’re paying per click[5][4] |
| CPA (Cost Per Action) | Total Spend ÷ Number of Actions | Measure the cost of achieving specific goals (e.g., sign-ups)[5][4] |
| ROAS (Return on Ad Spend) | Revenue ÷ Ad Spend | Gauge the profitability of your campaign[6][4] |
How to Measure and Track Facebook Engagement
Using Meta Business Suite Insights
Meta Business Suite is a handy tool for tracking engagement across Facebook Pages. By navigating to Insights > Content, you can review key metrics like reactions, comments, shares, and link clicks for each post[5].
The Audience Tab provides a closer look at your followers, breaking down demographic details such as age, gender, and location - even narrowing it down to specific cities or countries[5][4]. This data can help you tailor your content to resonate with your most active audience segments. For video content, head to Insights > Video to examine 3-second views and audience retention graphs[5]. Retention charts are especially useful for identifying when viewers drop off, allowing you to refine your video openings to keep them engaged longer.
"It really depends on executives' goals and what they want to get out of posting. But for the most part, it's either brand awareness (reach/views) or new leads (conversions, link clicks, sign-ups, etc)."
- Nia Patel, Content Strategist[4]
For paid campaigns, tools like Facebook Ads Manager can track metrics such as cost-per-click (CPC) and click-through rate (CTR)[1][5]. If you're managing a Facebook Group with over 50 members, Group Insights offers valuable data on top contributors, active members, and trends in community growth[5][9]. To make engagement comparisons easier, use content labels to categorize posts by themes like educational or promotional content[9][4].
Once you've gathered your engagement data, use it to benchmark your performance and set clear, actionable goals.
Benchmarking and Pattern Analysis
After collecting insights from Meta Business Suite, compare your engagement metrics to industry standards to see how you're performing. For reference, the median Facebook engagement rate is currently around 3.0% to 3.6%[7][11]. Keep in mind that these rates can vary widely depending on account size. For instance, smaller accounts with fewer than 5,000 followers often achieve engagement rates closer to 0.30%, which is double the general average of 0.15%[8]. Filtering benchmarks by follower count can help you set realistic, achievable goals.
It’s also a good idea to track your engagement month-over-month to identify seasonal trends or shifts in your strategy. For example, Facebook engagement rates saw an 18% increase during the first half of 2025 compared to the same period in 2024, peaking at 0.20% in May[8]. If you notice a dip during a specific time, check whether it’s part of a larger industry trend or something unique to your content. Categorizing your posts - such as grouping educational content separately from promotional ones - can help you identify which type consistently performs better[4].
"A benchmark is a standard that you can measure your own performance against... Our goal is to help you on your own Facebook journey by letting you see how others are doing."
When analyzing metrics like reach and engagement, use medians instead of averages to avoid skewed results caused by viral posts[7]. You can also estimate the "organic value" of your reach by calculating how much it would have cost to achieve the same visibility through paid ads[4].
These benchmarks and analyses will give you a clearer picture of how your engagement efforts are impacting audience growth.
Tracking Audience Growth and Engagement
To refine your content strategy, combine engagement metrics with audience growth analysis. Tracking follower growth alongside engagement rates adds valuable context to your performance. On average, Facebook accounts see a monthly follower growth rate of 8.3%[7]. However, instead of solely relying on industry averages, compare your current stats to your own historical data. For example, if your engagement rate was 0.18% three months ago but has dropped to 0.12%, it’s a sign to adjust your approach - even if you're still outperforming the general average[3].
Don’t just focus on numbers - pay attention to qualitative signals like comment sentiment or whether users are tagging friends or moving conversations to private messages. These behaviors often indicate a deeper connection with your audience[3][4].
To dig even deeper, use UTM parameters to measure how engagement translates into website traffic and conversions[6]. While high engagement is always a good sign, low click-through rates to your site could suggest that your content is engaging but not persuasive enough to drive further action. With brands posting an average of 43 times per month on Facebook[8], experimenting with different posting frequencies can help you discover what resonates best with your audience.
How to Improve Facebook Engagement Using Metrics
Analyzing Engagement Patterns
To refine your content strategy, dig into your engagement metrics and look for patterns. Start by categorizing your posts into themes like user-generated content, educational material, or behind-the-scenes glimpses. This approach helps identify which types of content resonate most with your audience. For example, if user-generated posts consistently outperform others, it’s a clear sign to prioritize them in your plan[4].
Focus on engagement rate by reach rather than just follower count. This metric gives a better sense of how engaging your content is to the people who actually see it, offering a more accurate reflection of quality[3]. Also, don’t overlook the sentiment behind interactions. A post with 200 comments might seem like a hit, but if most of those comments are complaints, it points to a different issue that needs addressing[4].
"Metrics can hint at reach or fatigue, but sentiment tells you whether you're actually connecting."
- Tyla Ng, Social Media and Community Manager, Guusto[3]
Different content formats lead to different outcomes. Photo albums tend to drive more likes, while status posts with open-ended questions encourage comments[8]. For pages with over 100,000 followers, video content often generates more shares and broader reach[8]. The key is to align your format with your goals - whether that’s increasing brand awareness through shares or building community through comments. These insights can serve as a foundation for fine-tuning your strategy.
Timing and Content Strategy
Use tools like Meta Business Suite to identify when your audience is most active and schedule posts to align with those peak times[1]. The first few minutes after posting are crucial - early engagement signals to Facebook’s algorithm that your content is worth showing to a larger audience[3].
"Timing can quietly make or break your Facebook engagement... Those first minutes matter. Early likes, comments, and shares signal to Facebook that your post is worth showing to more people."
- Nidhi Parikh, SaaS Writer[3]
Consistency is more important than perfection. Pages that post regularly can see up to 5x more engagement compared to those with irregular schedules[7]. Many marketers suggest posting 2-3 times per week to maximize engagement[1]. If daily posting leads to diminishing returns, consider scaling back to fewer, higher-quality posts each week and monitor how your audience responds. For global audiences, adjust your posting times to match the activity patterns of your largest demographic[1].
While industry data suggests that Tuesday through Thursday between 1 PM and 3 PM often performs well, your audience may behave differently[2]. Use your own historical data to guide your schedule, and test various posting times to see what works best for your specific audience.
Testing and Adapting Your Approach
Make experimentation part of your routine. Test one variable at a time - like posting frequency, content format, or call-to-action - and track how it impacts engagement metrics[3]. For video content, monitor audience retention to identify when viewers start dropping off. If there’s a sharp decline in the first few seconds, try stronger opening hooks or shorter videos to keep attention[5].
Prioritize meaningful interactions such as comments, shares, and reactions like Love, Care, or Wow, as Facebook’s algorithm values these more than standard likes[2]. Create content that naturally encourages these deeper forms of engagement. Additionally, giveaways can be a powerful tool - 62.2% of marketers use them to boost exposure, with 58.7% reporting increased engagement as a result[3].
"A 'good' engagement rate doesn't exist in a vacuum... I benchmark performance against historical results, not industry averages."
- Tyla Ng, Social Media and Community Manager, Guusto[3]
If your goal is to drive traffic to your website, keep an eye on your click-through rate (CTR). High engagement but low CTR might mean your content grabs attention but doesn’t compel viewers to take action[6]. Experiment with stronger calls-to-action, better link placements, or more enticing preview text. For smaller pages (under 5,000 followers), engagement rates around 0.30% are common and often higher than the average[8]. Lastly, aim to respond to comments within an hour. Quick replies not only keep conversations going but also signal value to Facebook’s algorithm[2].
Facebook Insights: EXPOSED! Use Data to Understand Your Audience
## ConclusionFacebook engagement metrics take the guesswork out of social media strategies, offering data-driven insights to help you navigate the platform's ever-changing algorithm and tackle challenges like declining organic reach[5][9].
Forget chasing vanity metrics. Instead, prioritize meaningful interactions that align with your business objectives. By focusing on proven content pillars rather than fleeting viral trends, you can craft a more precise and goal-oriented approach[4].
Consistently monitoring these metrics helps you spot shifts in audience behavior over time, enabling you to adjust your strategy proactively. This approach ties social engagement to tangible results like lead generation, sales, or brand awareness. In fact, 50% of business leaders now use social media metrics to guide their company’s strategic decisions[12].
Here’s how to put these insights into action: Start by matching your metrics to specific goals. For example, track reach and impressions if your focus is brand awareness, but shift to conversion rates and click-through rates for campaigns aimed at driving sales[5][4]. Use UTM parameters on shared links to measure website traffic and assess lead quality through Google Analytics[9][12]. Experiment with posting schedules, content formats, and timing to see what resonates most with your audience. Keep in mind that engagement rates often vary based on account size - smaller accounts typically see higher percentages[8].
FAQs
What are the best ways to boost my Facebook engagement rate?
Boosting your Facebook engagement rate means driving up the number of likes, comments, shares, and clicks compared to your audience size. A solid goal to aim for is an engagement rate above 3.8%, which represents the industry median.
To get there, try posting 2–3 times per week during peak activity hours. You can use Facebook Insights to pinpoint the best times to reach your audience. Mix up your content with formats like short videos, carousel posts, and Stories - visual posts often draw more attention. Don’t forget to include clear calls-to-action, like asking questions, running polls, or encouraging users to tag friends. Quick responses to comments can also help you build stronger connections with your followers.
Keep experimenting with your approach and use analytics to fine-tune your strategy. Pay attention to which types of posts and topics perform well, and adjust your content based on those insights. A/B testing elements like headlines or images can also reveal what resonates most with your audience. By staying consistent and using data to guide your decisions, you'll see steady improvements in your engagement over time.
What do Facebook reactions reveal about how my audience feels?
Facebook reactions - Like, Love, Haha, Wow, Sad, and Angry - give you a quick glimpse into how your audience feels about your content. Each reaction adds to your engagement metrics but reflects a unique sentiment. For instance, a Love reaction usually signals strong positive emotions, while Sad or Angry might point to concern, frustration, or disagreement.
To truly understand what these reactions mean, it’s important to look at them in context. Combine them with comments and other engagement data to get a clearer sense of how your content connects with your audience on an emotional level.
Why do live videos drive more engagement on Facebook?
Live videos on Facebook are incredibly engaging because they offer a real-time experience that feels immediate and genuine. When viewers tune in, they’re part of something happening right now, which often motivates them to comment, react, and share. Plus, Facebook’s algorithm gives live content a boost, pushing it to the top of users’ feeds while the broadcast is active.
Another big advantage of live videos is the direct interaction they allow. Creators can chat with their audience through live Q&A sessions, give shoutouts, or respond to feedback on the spot. This kind of real-time communication builds stronger connections and keeps viewers watching longer than pre-recorded videos typically do.
Last updated: January 21, 2026