LinkedIn Engagement Rate: How to Calculate
Tracking your LinkedIn engagement rate is key to understanding how well your content connects with your audience. This metric measures the percentage of viewers who interact with your posts through likes, comments, shares, clicks, and follows, compared to total impressions. Here's the formula:
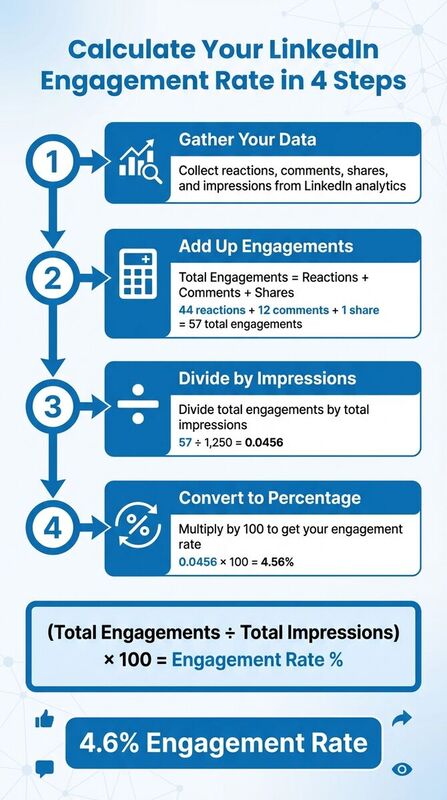
Engagement Rate = (Total Engagements ÷ Total Impressions) × 100
Why It Matters:
- Better Visibility: LinkedIn's algorithm prioritizes engaging content, increasing your reach.
- Content Effectiveness: A higher rate shows your content resonates with your audience.
- Refined Strategy: Low engagement may signal it's time to adjust your messaging or format.
Example Calculation:
- Gather data: A post with 1,250 impressions, 44 reactions, 12 comments, and 1 share = 57 total engagements.
- Apply formula: (57 ÷ 1,250) × 100 = 4.6% engagement rate.
Industry benchmarks vary:
- Marketing: 0.45%–0.60%
- Education: 0.40%–0.55%
- Technology: 0.35%–0.50%
Tools like analytics dashboards or social media management platforms can simplify tracking. Focus on quality interactions to improve your LinkedIn strategy.
How Do I Calculate LinkedIn Engagement Rate? - Social Media Business Playbook
## What is LinkedIn Engagement Rate?LinkedIn engagement rate reflects how well your content resonates with your audience. It’s calculated as a percentage, comparing the total interactions (reactions, comments, shares, clicks) to the total impressions your post receives.
"Engagement rate on LinkedIn is the amount of interaction your content receives relative to your audience size. It includes likes, comments, reposts, shares, and custom button clicks." - Jason Gong, Head of Growth, Bardeen [2]
Think of it as a scorecard for your content's effectiveness. For example, a post with 10,000 impressions and 200 engagements (2% rate) outperforms a post with the same impressions but only 50 engagements (0.5% rate). A higher engagement rate means your audience is connecting more with what you’re sharing. On the other hand, high impressions but low engagement suggest it might be time to rethink your approach - whether that’s tweaking your messaging, changing your format, or exploring new topics [1].
Now, let’s break down the two key components of this calculation: engagements and impressions.
Key Metrics: Engagements and Impressions
Engagements capture all the ways users interact with your content. These include:
- Reactions: Quick responses like Like, Celebrate, Support, Love, Insightful, and Funny, which show approval and boost visibility.
- Comments: Written replies that foster conversations and indicate deeper interest.
- Shares: Reposts (with or without added thoughts) that expand your content's reach to new audiences.
- Clicks: Actions like clicking links, images, videos, or the "see more" button, reflecting an intent to explore further.
- Follows: When someone follows your page directly from a post, signaling long-term interest in your updates [1][5].
Impressions, on the other hand, measure how often your content appears on users’ screens. LinkedIn counts an impression only when at least 50% of your post is visible for 300 milliseconds [5]. This stricter definition means LinkedIn’s impression numbers might be lower compared to platforms that count impressions as soon as a post loads.
| Metric Type | Actions Included | Why It Matters |
|---|---|---|
| Reactions | Like, Celebrate, Support, Love, Insightful, Funny | Reflects sentiment and boosts visibility |
| Comments | Text replies to the post | Drives conversations and deeper engagement |
| Shares | Reposts (with or without added thoughts) | Expands reach and signals credibility |
| Clicks | Link clicks, image clicks, "see more" | Shows intent to explore or learn more |
| Follows | Follows from the post | Indicates sustained interest in your brand |
Understanding these metrics is crucial to improving your LinkedIn engagement rate and tailoring your content to better connect with your audience.
How to Calculate LinkedIn Engagement Rate Manually
The Engagement Rate Formula
To calculate LinkedIn's engagement rate, use this formula: (Total Engagements ÷ Total Impressions) × 100. Here, Total Engagements includes reactions, comments, shares, clicks, and follows, while Total Impressions represents how many times your post appeared on users' feeds. This formula gives you the percentage of viewers who interacted with your post [3].
Step-by-Step Calculation with Example
Manually calculating engagement rates helps you better understand how your content is performing. Let’s break it down:
- Step 1: Gather your post analytics data. Look at the reactions, comments, shares, and impressions from LinkedIn's analytics view.
- Step 2: Add up all engagements. For example, if your post has 44 reactions, 12 comments, and 1 share, your total engagements are 57.
- Step 3: Divide the total engagements (57) by the total impressions (1,250). This gives you 0.0456.
- Step 4: Multiply the result by 100 to convert it into a percentage. In this case, 0.0456 × 100 = 4.56%.
This means about 4.6% of the people who saw your post engaged with it, which is a solid result compared to industry averages.
Calculating for Individual Posts vs. Company Pages
The way you calculate engagement rates may vary depending on whether you're analyzing a personal profile or a company page. Here's how to adjust:
Personal Profiles:
- Use the "View analytics" option to find data on reactions, comments, and impressions.
- Calculate engagement rates using the formula: (Reactions + Comments) ÷ Impressions.
- Note: Clicks and follows are not displayed for personal profiles in the standard analytics view.
Company Pages:
- Access detailed metrics by clicking "Show stats" on individual posts or through the Analytics tab for a broader overview.
- Company pages provide additional insights, including clicks and follows.
- Use the "Export" button to download data for multiple posts, which makes it easier to analyze trends.
- Separate organic engagement from sponsored engagement to understand which content performs better without paid promotion.
These metrics not only guide your manual calculations but also help you refine your content strategy and prepare for deeper analysis with advanced tools.
LinkedIn Engagement Rate Benchmarks by Industry
Typical Engagement Rate Ranges
When setting goals for your LinkedIn engagement, it's helpful to compare your metrics against industry standards. Engagement rates can vary significantly depending on the sector.
- Marketing and Advertising: Engagement rates typically range from 0.45% to 0.60%, reflecting the industry's focus on creating conversational and interactive content[1].
- Education and Training: With rates between 0.40% and 0.55%, this sector benefits from content that encourages discussion and knowledge sharing[1].
- Technology and Software: Companies in this field usually see engagement rates of 0.35% to 0.50%[1].
- Healthcare and Pharmaceuticals: Engagement here tends to fall between 0.25% and 0.40%[1].
- Finance and Insurance: As a more conservative sector, engagement rates are lower, averaging 0.20% to 0.35%[1].
| Industry | Average Engagement Rate |
|---|---|
| Marketing and Advertising | 0.45% - 0.60% |
| Education and Training | 0.40% - 0.55% |
| Technology and Software | 0.35% - 0.50% |
| Healthcare and Pharmaceuticals | 0.25% - 0.40% |
| Finance and Insurance | 0.20% - 0.35% |
For posts, an engagement rate between 1% and 8% is generally considered strong. Leading accounts often hit 5% to 10%, and smaller audiences sometimes exceed these benchmarks[1][2][3][4].
Interestingly, Microsoft highlighted record LinkedIn engagement levels in 2024, showcasing the platform's growing importance for businesses and individuals alike[6].
These benchmarks provide a solid foundation for tracking your performance and identifying opportunities to refine and improve your LinkedIn strategy.
Using Tools to Track LinkedIn Engagement
Benefits of Social Media Management Tools
Tracking LinkedIn engagement manually can feel like a full-time job, especially when juggling multiple posts or accounts. That’s where social media management tools come in - they take care of the heavy lifting by automating engagement rate calculations. For example, these tools use the formula: Total Engagements ÷ Total Impressions x 100, saving you from tedious data collection tasks [1].
These platforms also bring all your engagement metrics - likes, comments, shares, and clicks - into one easy-to-navigate dashboard. With everything in one place, you get a clear snapshot of how your content is performing without having to dig through LinkedIn’s interface.
Another standout feature is their cross-posting capabilities. Tools like TheBlue.social offer a scheduler that lets you plan and manage your content calendar across LinkedIn and other platforms like X (formerly Twitter), Threads, Instagram, Pinterest, Bluesky, and Mastodon. This ensures your messaging stays consistent across channels while making your workflow more efficient.
On top of that, many of these tools allow you to compare your performance to industry benchmarks, giving you valuable context about how your content stacks up [1].
Free Tools for LinkedIn Users
If you're looking to enhance your LinkedIn strategy without breaking the bank, there are several free tools worth exploring. For instance, TheBlue.social offers a LinkedIn Username Checker to quickly verify handle availability. This can be especially helpful when setting up new accounts or rebranding.
Another handy tool is the Is LinkedIn Down? status checker, which helps you determine if platform issues are behind any sudden engagement drops.
For those focused on optimizing content, the Open Graph Preview Tool lets you see how your LinkedIn posts will appear when shared across other platforms. And if you’re looking to expand your reach, the Generate Hashtags feature can suggest relevant hashtags to help your posts gain more visibility.
These free resources make it easier to fine-tune your LinkedIn approach while keeping costs low.
Conclusion
Tracking LinkedIn engagement helps you understand what truly connects with your audience. By using the formula (Reactions + Comments + Shares + Clicks) ÷ Impressions × 100, you can measure how well your content resonates and use that insight to shape future posts.
This isn't just about numbers - it’s about strategy. 89% of practitioners believe LinkedIn is the most effective platform for organic social media content [7]. Regularly monitoring engagement rates gives you the data you need to refine your approach and amplify what works. As Steve Kearns, AI & Marketing Leader and LinkedIn Alum, explains:
"Engagement metrics are the primary indicator that people are actually consuming and interacting with content and ads" [7].
Strong engagement signals LinkedIn’s algorithm that your content provides value, which can increase organic reach and strengthen your brand’s authority. This has real-world benefits, from generating leads to boosting sales and uncovering professional opportunities.
Whether you calculate engagement manually or rely on tools like TheBlue.social, the focus should always be on quality over quantity. It’s not just about how many people engage but who they are - their roles, seniority, and industries. Use dips in engagement as a cue to rethink your strategy, and keep in mind that organizations posting at least once a week see 2× more engagement than those that don’t [7].
FAQs
How can I increase my LinkedIn engagement rate?
To improve your LinkedIn engagement rate, focus on crafting content that resonates with your audience and invites interaction. Aim to post consistently - ideally 1-2 times per day - and include eye-catching visuals like images or videos to grab attention. Interactive elements such as questions, polls, or sharing useful insights can also spark more likes, comments, and shares.
Don't just focus on your own posts - engage with others by commenting on and sharing their updates. This increases your visibility and encourages mutual interaction. Keep an eye on your performance by tracking metrics like likes, comments, shares, and impressions. To calculate your engagement rate, use this formula: (Total Engagements ÷ Impressions) × 100. Use these insights to fine-tune your content strategy and double down on what’s working to build a stronger LinkedIn presence.
What are the common mistakes that reduce engagement on LinkedIn?
Low engagement on LinkedIn often boils down to a few common missteps. For starters, a poorly crafted profile can make a big difference. For example, using a generic headline that doesn’t clearly convey your value or appeal to your target audience can make it tough to stand out. On top of that, overloading your posts with emojis or breaking up text with too many line breaks can hurt readability and turn people away.
Another issue is inconsistency. If you’re not posting regularly or if your content feels overly sales-focused without offering any real value, people are less likely to engage. Engagement is a two-way street - ignoring comments on your posts or failing to interact with others by commenting on their content can also make your presence feel disconnected. And let’s not forget about automation - relying heavily on automated tools or sending impersonal connection requests can come off as insincere, which doesn’t encourage meaningful interactions.
To turn things around, focus on sharing content that provides value, engage genuinely with others, and stick to a consistent posting schedule. These small shifts can make a big impact.
How do industry benchmarks influence my LinkedIn strategy?
Industry benchmarks play a key role in shaping your LinkedIn strategy by giving you a baseline to measure your content’s performance. For example, a LinkedIn engagement rate of about 2% is often seen as a strong indicator that your audience finds your posts engaging. Comparing your metrics to these benchmarks helps you understand whether your content is hitting the mark or falling short.
If your engagement rate is below the benchmark, it might be time to rethink your approach - whether that means creating more engaging content, improving your audience targeting, or tweaking your posting schedule. On the flip side, if you’re consistently surpassing benchmarks, it’s a sign that your strategy is effective and could be scaled up for even greater impact. Leveraging benchmarks allows you to set practical goals and fine-tune your LinkedIn efforts to align with the top practices in your industry.
Last updated: February 2, 2026