Twitter Engagement Rate Benchmarks 2025
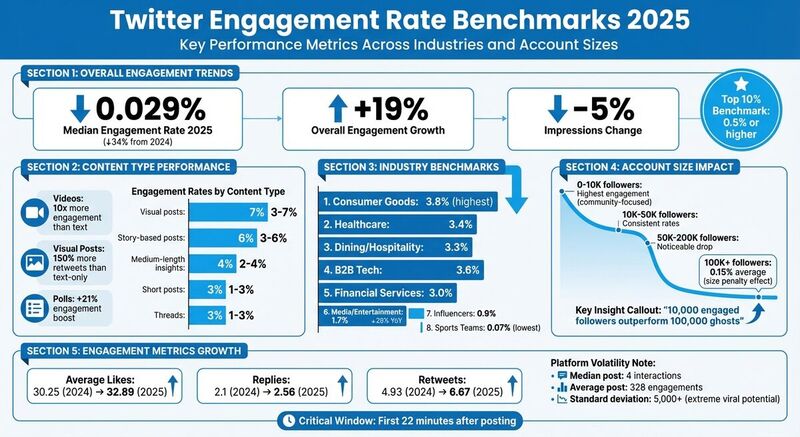
In 2025, Twitter's median engagement rate fell to 0.029% - a 34% drop from 2024. Despite this, overall engagement grew by 19%, even as impressions declined by 5%, signaling a shift toward prioritizing meaningful interactions over passive scrolling.
Key insights:
- Top 10% benchmark: Accounts with a 0.5% engagement rate or higher.
- Content performance: Visual posts outperform text by 150% more retweets, while videos drive 10x more engagement.
- Industry leaders: Consumer goods lead with 3.8% engagement, while sports teams trail at 0.07%.
- Account size impact: Smaller accounts (0–10K followers) see higher engagement, while larger accounts (100K+ followers) average just 0.15%.
To succeed, focus on visual content, post timing (within the first 22 minutes), and meaningful metrics like bookmarks and profile visits. Tools like TheBlue.social can help optimize performance by tracking "Real Rate" (engagements ÷ impressions) and automating cross-platform posting.
Twitter/X Analytics Explained (How I got 4M Impressions)
2025 Engagement Rate Data and Changes
Visual content continues to lead the way in driving interaction. Posts with images generate 150% more retweets than text-only tweets, and videos outperform plain text by delivering 10 times more engagement. Polls also make a strong showing, offering a 21% boost in engagement.
When it comes to engagement rates by content type, the numbers vary:
- Visual posts: 3% to 7%
- Story-based posts: 3% to 6%
- Medium-length insight posts: 2% to 4%
- Short, punchy posts: 1% to 3%
- Threads: 1% to 3% (though threads are more effective for audience growth than engagement)
These figures help establish benchmarks for content performance across industries.
Engagement by Industry
Engagement rates differ significantly depending on the industry. Here's how they stack up:
- Consumer goods: 3.8% (highest)
- Healthcare: 3.4%
- Dining and hospitality: 3.3%
- Financial services: 3.0%
- Media and entertainment: 1.7% (a steep 28% drop compared to last year, hinting at audience fatigue)
- Sports teams: 0.07% (the lowest)
Impact of Account Size
The size of an account also plays a major role in engagement rates. Smaller accounts (0–10K followers) see the highest engagement rates, benefiting from closer, community-like interactions. Mid-size accounts (10K–50K) experience more consistent rates as their audience grows. However, larger accounts (50K–200K) face a noticeable drop in engagement as impressions increase but interactions fail to scale proportionally. Among large accounts, those with over 100K followers average just 0.15% engagement, illustrating how growth can dilute direct interaction.
Engagement Trends and Platform Metrics
Even with declining rates, some metrics show improvement. For example:
- Average likes increased from 30.25 in 2024 to 32.89 in 2025.
- Replies rose from 2.1 to 2.56.
- Retweets jumped from 4.93 to 6.67.
However, the platform remains unpredictable. Half of all posts still receive 4 or fewer interactions, and while the average engagement per post is 328, this figure is heavily skewed by viral content. With a standard deviation exceeding 5,000, Twitter (X) continues to be a platform where extreme viral moments can coexist with relatively low average engagement.
1. Overall Twitter Engagement Benchmarks
Engagement Rate Trends
The engagement rate on Twitter saw a noticeable shift in 2025. The median engagement rate dropped to 0.029%, marking a 34% decline compared to 2024. To rank in the top 10%, accounts needed an engagement rate of at least 0.5% [2]. This drop highlights the importance of tailoring strategies to both specific industries and account sizes.
Twitter's engagement dynamics are a mix of extremes. While half of all posts see just 4 interactions, the average engagement per post is 328. This disparity is driven by viral content, with some posts significantly skewing the numbers. The standard deviation of over 5,000 engagements reflects this volatility [3]. By focusing on trends specific to industries and account sizes, brands can refine their content strategies for better outcomes.
Industry Performance
Engagement rates vary significantly across industries. Consumer goods lead the pack with a median engagement rate of 3.8%, followed by healthcare at 3.4% and dining/hospitality at 3.3% [2]. Financial services remain steady at 3.0%. On the other hand, media and entertainment saw a sharp 28% year-over-year decline, dropping to 1.7%. Sports teams fared even worse, registering a mere 0.07% engagement rate [2].
Interestingly, 2025 brought a surprising twist: B2B tech accounts outperformed general influencers, achieving a 3.6% engagement rate compared to influencers' 0.9% [2]. This shift emphasizes the evolving dynamics of audience interaction across different sectors.
Account Size Impact
Account size also plays a crucial role in engagement outcomes. Larger accounts (over 100,000 followers) average just 0.15% engagement, illustrating a "size penalty" where increased impressions don't translate into proportional interactions [2]. Smaller accounts (0–10K followers) see the highest engagement rates, likely due to their closer, more connected communities. Mid-size accounts (10K–50K) strike a balance, offering broader reach while maintaining steady engagement.
As Proolance aptly put it:
10,000 engaged followers outperform 100,000 ghosts.
This underscores the value of building a quality, engaged audience over simply chasing follower counts. These findings pave the way for a closer look at platform-specific strategies in the next section.
2. TheBlue.social
Tools and Strategies
Navigating the unpredictable world of social media engagement requires more than just guesswork - it demands smart planning. That’s where TheBlue.social comes in. This platform offers a cross-posting scheduler that simplifies the process of maintaining a consistent posting routine. With support for X (Twitter), Threads, Instagram, Pinterest, LinkedIn, Bluesky, and Mastodon, you can manage your content strategy seamlessly from one dashboard.
Timing and frequency are critical for boosting engagement. Research shows that posting 3–5 times daily and incorporating visual content can dramatically improve results - visuals alone can increase retweets by 150% [2]. TheBlue.social automates your scheduling, ensuring posts go live within the crucial 22-minute engagement window. This automation takes the guesswork out of timing, helping you maximize your reach and interactions [2].
If your account’s performance feels inconsistent, focusing on the right metrics is essential. Instead of chasing vanity numbers, hone in on meaningful data like bookmarks, profile taps, and specific engagement actions that truly reflect your content’s impact [1]. TheBlue.social’s analytics tools make it easy to track these metrics, helping you spot trends and refine your strategy. Whether it’s adjusting your posting times or tweaking underperforming content hooks, these insights let you make data-driven decisions.
Another advantage? Cross-platform posting. By tailoring your content to fit the unique dynamics of each platform while sticking to a cohesive overall strategy, you can tackle industry-specific challenges more effectively. TheBlue.social ensures that your message resonates across multiple channels without losing consistency.
Advantages and Disadvantages
When it comes to interpreting Twitter data, the trade-offs can be tricky. By understanding both the strengths and weaknesses of Twitter engagement benchmarks and performance tools, you can fine-tune your social media approach. Here's a closer look at what works - and what doesn’t.
| Category | Advantages | Disadvantages |
|---|---|---|
| Twitter Engagement Benchmarks | Provides baseline KPIs by industry (e.g., Consumer Goods 3.8%, Healthcare 3.4%) [2]. Helps identify whether your content is getting algorithmic traction or being ignored. | Often relies on "Vanity Metrics" like follower counts instead of impressions, which can distort performance insights. Benchmarks are unstable and heavily influenced by viral anomalies [3]. |
| TheBlue.social & Analytics Tools | Simplifies data collection and offers "Real Rate" calculations (Engagements ÷ Impressions), widely seen as more accurate [2]. Allows for scheduling at peak times and tracks critical behaviors like bookmarks and profile taps. Cross-platform posting ensures consistency across X, Threads, Instagram, Pinterest, LinkedIn, Bluesky, and Mastodon. | Requires a solid grasp of metrics like median vs. average engagement - tools are only as good as the user’s analytical skills. Access to advanced analytics often comes with subscription fees for historical data. |
| X Platform Characteristics | Enables massive viral potential with a high-risk, high-reward dynamic. Visual posts see 150% more retweets than text-only posts [2]. B2B tech accounts outperform influencers with engagement rates of 3.6% vs. 0.9% [2]. | Results are highly unpredictable - the median post garners only 4 interactions, while the standard deviation can exceed 5,000 engagements [3]. Engagement tends to drop as follower counts grow, making small-account benchmarks irrelevant for larger brands. |
One of the biggest hurdles in social media analytics is metric confusion. As @DataGuru2025 aptly explains:
Comparing public and private rates is like weighing yourself with clothes on vs. naked - only one shows the truth [2].
For example, a post might show a "Real Rate" of 1.05% (based on impressions) versus a "Vanity Rate" of 0.3% (based on followers), leading to skewed perceptions of success [2].
The key is to prioritize meaningful metrics. Instead of obsessing over follower counts, focus on actions that indicate algorithmic favor - like bookmarks, profile taps, and engagement within the critical 22-minute window after posting [2]. Tools like TheBlue.social are invaluable for tracking these actionable metrics, offering a clearer picture of your content’s performance while addressing gaps that public benchmarks often overlook.
Conclusion
By 2025, Twitter's median engagement rate dipped to 0.029%, yet the platform still holds massive potential for viral content. Accounts with a Real Rate over 0.5% are thriving, and those surpassing 1% sit in an elite category. This shift in metrics highlights the need for smarter strategies and well-timed posting.
To navigate this changing landscape, focus on meaningful interactions rather than surface-level metrics. Your Real Rate - calculated by dividing total engagements by impressions - is a critical measure. Timing also matters: aim for the 22-minute window where 15 or more interactions can boost your post's visibility through the algorithm. Posting between 9 AM and 3 PM and emphasizing high-value actions like bookmarks and profile taps can further improve your results [1][2].
Tools like TheBlue.social simplify this process by automatically tracking your Real Rate and optimizing post schedules for peak engagement times. Plus, its cross-posting feature ensures your content remains consistent across platforms like X, Threads, Instagram, Pinterest, LinkedIn, Bluesky, and Mastodon. These capabilities make it easier to implement a data-focused content strategy.
To maximize engagement, prioritize visual posts (which can generate 150% more retweets than text-only tweets), maintain strict niche focus (off-topic posts can reduce engagement by up to 73%), respond to replies within 15 minutes, aim for a 2:1 follower-to-following ratio, and use polls strategically (which can boost engagement by about 21%) [2].
FAQs
How do I calculate my Real Rate on X?
To figure out your actual engagement rate on X, take the total number of interactions - this includes likes, replies, reposts, and bookmarks - and divide it by your total follower count. Then, multiply that number by 100 to express it as a percentage. It's a straightforward way to gauge how engaged your audience is.
What engagement rate should I aim for by account size?
In 2025, a good engagement rate is considered 0.5% or higher, while top-performing accounts can often hit 1% or more. However, this can vary based on the size of your account and the nature of your audience.
Which post types boost engagement the most in 2025?
In 2025, the content that sparks real conversations and encourages meaningful interactions stands out the most. Platforms like Bluesky are becoming hubs for deeper discussions and thriving niche communities, where users connect over shared interests. Over on X (formerly Twitter), engagement often hinges on high-quality replies, thoughtful retweets, and responses that truly resonate with the audience. It's all about creating content that invites participation and makes people feel part of a conversation.
Last updated: March 14, 2026