Bluesky Analytics Tools for Campaign Performance
Running a successful Bluesky campaign requires more than just posting content - you need analytics to measure performance and refine your strategy. While Bluesky's native tools offer basic metrics like likes, reposts, and replies, third-party tools provide deeper insights to improve engagement and growth. Here’s what you need to know:
- Engagement Rates: A rate of 3%-6% is good; above 6% is excellent. Smaller accounts may achieve 5%-10%.
- Follower Growth: Track weekly or monthly. Healthy growth ranges from 10%-30% per month.
- Key Metrics: Focus on likes, reposts, replies, and quotes. Use reply ratios (replies ÷ likes) to measure community interaction.
- Top Tools: Platforms like TheBlue.social offer advanced features like heatmaps for peak posting times, follower growth tracking, and post-performance analysis.
Use analytics to identify trends, optimize your posting schedule across platforms, and connect your efforts to tangible results like website traffic and conversions. Without measurement, your campaign is just guesswork.
Bluesky Analytics & Scheduling Walkthrough
## Metrics to Track for Campaign Performance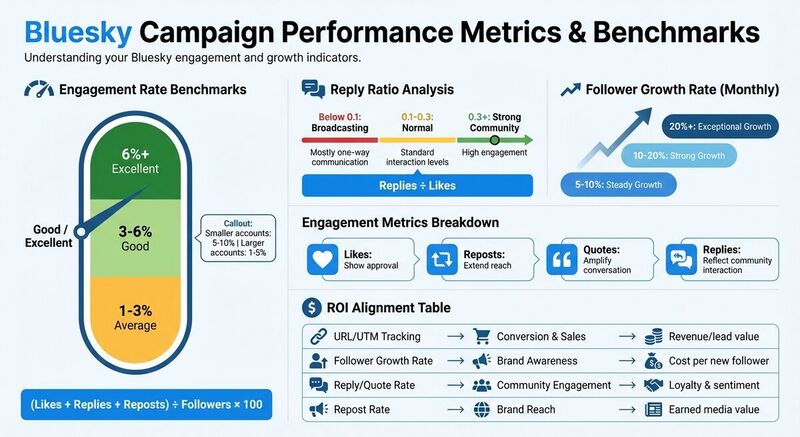 To refine your campaign's success, it’s essential to focus on key metrics that offer actionable insights. On Bluesky, tracking the right data points provides a clear picture of how your efforts are performing.
Engagement Metrics
Engagement metrics like likes, reposts, quotes, and replies are central to measuring how well your content connects with your audience[5]. Each metric serves a distinct purpose:
- Likes show approval.
- Reposts extend your reach.
- Quotes amplify the conversation.
- Replies reflect community interaction[3].
To calculate your engagement rate, use this formula:
(Likes + Replies + Reposts) ÷ Followers × 100[3].
On Bluesky, engagement rates can vary:
- 1–3%: Average
- 3–6%: Good
- 6%+: Excellent
Smaller accounts often achieve rates between 5–10%, while larger accounts typically see 1–5%[2].
Another useful metric is the reply ratio:
Replies ÷ Likes.
- Below 0.1: Indicates you’re mostly broadcasting.
- 0.1–0.3: Normal interaction levels.
- 0.3 or higher: Signals strong community engagement[3].
Follower Growth Tracking
While your total follower count reflects your baseline reach, tracking growth over time provides more meaningful insights[3]. Monitor growth weekly or monthly to identify trends:
- 5–10% per month: Steady growth.
- 10–20% per month: Strong growth.
- 20%+ per month: Exceptional growth[2].
Pay close attention to net follower gains or losses. Spikes in growth often correspond to successful posts or campaigns, while declines may suggest your messaging needs adjustment. Since Bluesky doesn’t offer historical growth tracking, a simple weekly spreadsheet can help you connect changes to specific campaigns or content[3].
Post Performance Analysis
Analyzing your top-performing posts is key to understanding what resonates with your audience[5]. Look at factors like format, topic, tone, and length to identify patterns.
For example, does your audience engage more with questions, actionable tips, or visuals? Identifying these preferences helps you focus your efforts where they’ll have the most impact. Tools like Bluesky Network Statistics from TheBlue.social can track these trends over time, helping you refine your content strategy effectively.
TheBlue.social's Bluesky Analytics Features
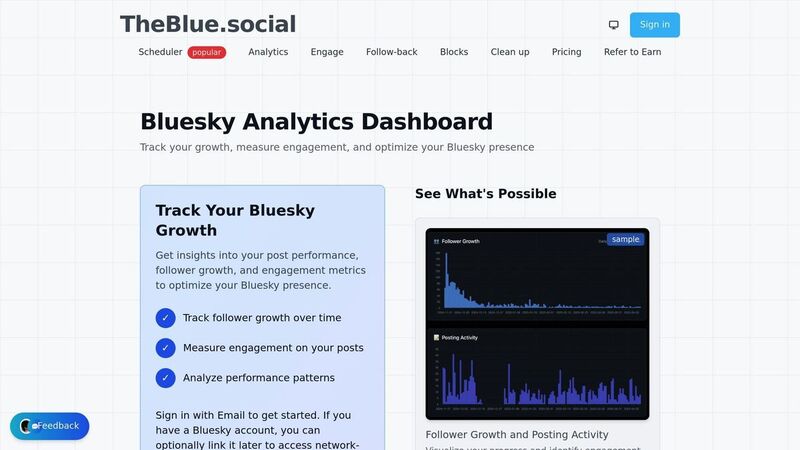
TheBlue.social takes campaign tracking to the next level with advanced analytics tools designed for Bluesky campaigns. Its dynamic dashboard refreshes multiple times per hour, ensuring you have real-time engagement data to support time-sensitive strategies[1].
Engagement and Follower Growth Tracking
This platform provides detailed insights into follower growth and posting activity over 7, 30, and 90-day periods[1]. Whether you're analyzing short-term campaign results or uncovering long-term trends, TheBlue.social delivers the flexibility you need. Dive into specific metrics like likes, replies, reposts, and quotes to calculate precise engagement rates[1].
One particularly useful feature is the "When Posts Get Liked" heatmap, which highlights the hours when your content historically performs best[1]. Use this data to schedule posts during peak engagement times. Additionally, the platform includes a follow-back tool that simplifies managing new connections during growth-focused campaigns.
Bluesky Network Statistics
The Bluesky Network Statistics tool allows you to benchmark your campaign performance against broader platform trends[1]. By linking your Bluesky account, you gain access to network-specific analytics, offering deeper insights and a richer context for your campaign results[2].
Additional Tools for Campaign Optimization
TheBlue.social also provides free tools to fine-tune your campaigns. These include an emoji stats tool, a hashtag generator, an alt text generator, and an auto emoji suggester. These resources make it easier to enhance your content and maximize engagement.
How to Use Analytics to Improve Campaign Results
Turning raw data into actionable steps is the real key to improving campaign performance. Metrics only matter when they lead to meaningful changes. Start by creating a baseline - track at least 30 days of data or analyze 20–30 posts before making any big changes [3][5]. This serves as your "before" snapshot, helping you see whether new strategies are actually making an impact [5].
Finding Your Best-Performing Content
Break down your engagement metrics into four categories: Likes (showing approval), Reposts (indicating reach), Quotes (sparking dialogue), and Replies (building community) [5]. Organize your posts by these metrics to figure out what resonates most with your audience [4][5]. Use the benchmarks you've already established to measure success.
Pay close attention to your reply ratio to assess how much conversation your posts generate. A reply ratio of 0.3 or higher signals strong community engagement rather than just broadcasting content [3]. Review your top-performing posts every month to spot patterns that work [3]. If you don’t use paid tools, manually track weekly metrics to identify trends over time [3]. Compare different content types - like plain text, images, and videos - to see which ones deliver the best return on investment [5].
Optimizing Your Posting Schedule
Tools like TheBlue.social's "When Posts Get Liked" heatmap can show you exactly when your audience is most active and engaged, broken down by day and hour [1]. Use these insights to fine-tune your posting schedule. Log the time of each post and compare it to metrics like likes, replies, and reposts to figure out the best windows for engagement [3]. Avoid "dead zones", or low-engagement periods, where your posts risk being overlooked [4].
Shift your primary content to the peak engagement times identified by analytics [3]. On Bluesky, where interaction is highly valued, focus on posting during times that encourage replies, not just likes [3]. Experiment with different times - like mid-morning versus late evening - and use performance reports to see which changes lead to better engagement [5]. Since 42% of Bluesky users expect brands to post at least once a day or a few times a week, consistency in timing is just as critical as finding the optimal time [5].
Measuring ROI and Campaign Goals
Analytics tools help translate your goals into measurable outcomes, aligning specific metrics with objectives like community building (replies/quotes), reach (reposts/quotes), or awareness (follower growth) [5]. As Sprout Social puts it:
"Growth without measurement is just guesswork" [5].
Because Bluesky doesn’t offer native conversion tracking, you’ll need to use URL tracking and UTM parameters to connect your posts to off-platform results like website visits, lead generation, or sales [3][5].
A good monthly follower growth rate ranges from 10% to 30% [2]. Use your reply ratio to gauge community engagement - again, a ratio of 0.3 or higher is a solid indicator [3]. Leverage post-performance reports to A/B test different types of content and scale up the approaches that yield the best ROI [5]. Since Bluesky doesn’t track impressions or views, rely on engagement metrics - likes, reposts, and replies - to measure how well your content connects with your audience [3][5].
| Metric | Business Goal Alignment | ROI |
|---|---|---|
| URL/UTM Tracking | Conversion & Sales | Revenue or lead value |
| Follower Growth Rate | Brand Awareness | Cost per new follower |
| Reply/Quote Rate | Community Engagement | Loyalty & sentiment |
| Repost Rate | Brand Reach | Earned media value |
Conclusion
Tracking the performance of your Bluesky campaigns effectively takes the guesswork out of your strategy. Since native dashboards are unavailable, third-party tools become essential for transforming raw data into insights you can act on. Without metrics like follower growth trends, engagement patterns, or optimal posting times, you're missing key information to guide your efforts.
This is where TheBlue.social steps in with its comprehensive solution. The platform offers tools to track follower growth over 7-, 30-, and 90-day intervals, monitor engagement metrics like likes, replies, reposts, and quotes, and refresh data multiple times an hour to ensure you're always up-to-date [1].
But it doesn’t stop at analytics. TheBlue.social provides a full suite of campaign tools, including cross-posting schedulers for platforms like X (Twitter), Threads, Instagram, Pinterest, LinkedIn, and Mastodon. Additionally, it features free utilities like Bluesky Network Statistics, emoji analysis, and alt text generation. These tools are designed to simplify your workflow and enhance your campaign's impact.
Armed with these insights, your campaigns can become more focused and measurable. Success on Bluesky isn't just about growing your follower count; it's about fostering genuine connections. Use analytics to pinpoint what resonates with your audience, amplify your best-performing content, and refine your strategy over time.
Ready to take the next step? Check out TheBlue.social's Bluesky Analytics to transform your campaign data into meaningful growth and deeper engagement.
FAQs
How do I calculate the engagement rate for my Bluesky campaign?
To figure out the engagement rate for your Bluesky campaign, you can use this straightforward formula:
Engagement rate = (likes + reposts + replies) ÷ impressions
This calculation helps you understand how often people interact with your content relative to how many times it’s been seen. Just add together the total number of likes, reposts, and replies your posts receive, then divide that sum by the number of impressions. The result, expressed as a percentage, gives you a clear picture of how your campaign is performing in terms of audience engagement.
What metrics should I track to grow my followers on Bluesky?
To increase your followers on Bluesky, start by keeping an eye on key metrics like your follower count and growth rate. These numbers give you a clear picture of how your audience is expanding over time. Another crucial metric to track is your engagement rate, which is calculated by dividing likes, reposts, and replies by the total impressions. This shows how well your content is connecting with your audience.
Dive deeper into your post performance metrics to figure out which types of posts get the best response. Also, pay attention to optimal posting times - sharing updates when your audience is most active can make a big difference. Using these insights, you can fine-tune your approach and strengthen your presence on Bluesky.
What are the best times to post on Bluesky to boost engagement?
To get the most engagement on Bluesky, timing your posts is key. Typically, weekdays between 8:00 AM and 6:00 PM work well, with 10:00 AM often being a prime time for visibility. Additionally, early mornings - especially between 7:00 AM and 9:00 AM on Wednesdays and Thursdays - can also perform strongly.
Because Bluesky operates on a chronological feed, posting during these peak hours increases the likelihood that your content will catch your audience's attention. Tools like TheBlue.social can help you analyze engagement trends and fine-tune your posting schedule. By testing these time frames and reviewing your analytics, you can uncover the ideal posting times for your audience.
Last updated: May 22, 2026