Understanding Engagement Metrics for Feedback Insights
Engagement metrics are essential for understanding how your audience interacts with your content. They provide real-time feedback, helping you identify what resonates and what doesn't. On platforms like Bluesky, these metrics - likes, reposts, replies, and shares - offer valuable insights into audience behavior and content performance.
Key points to know:
- Engagement Rate: Measures how well your content connects with your audience. A rate above 5% is considered outstanding on Bluesky.
- Total Engagement: Tracks the total number of interactions (likes, reposts, replies) to assess overall activity.
- Sentiment Analysis: Goes beyond numbers to reveal audience emotions - positive, negative, or neutral - using tools like Talkwalker or Visibrain.
- Data Segmentation: Breaking down your audience by behavior or demographics helps tailor content for specific groups.
- Analytics Tools: Platforms like TheBlue.social provide real-time metrics, follower growth tracking, and cross-posting features to refine strategies.
Engagement Metrics in UX
Key Engagement Metrics for Analyzing Feedback
Understanding the right metrics can turn raw numbers into actionable insights. On Bluesky, three metrics stand out as essential for assessing audience feedback and gauging content success.
Engagement Rate: Gauging Content Connection
Engagement rate measures how well your content resonates by calculating the percentage of followers interacting with your posts. Christina Francisco, Adjunct Lecturer at Georgetown University, highlights its importance:
"Engagement rate is one of the most important metrics to measure content performance." [5]
On Bluesky, this is determined by dividing total engagement by your follower count at the time of posting [3]. This method levels the playing field for accounts of all sizes. For example, a creator with 1,000 followers and 50 interactions has the same 5% engagement rate as one with 10,000 followers and 500 interactions. This makes it easier to compare performance and identify successful content.
Engagement rate benchmarks help contextualize performance: under 1% is low, 1%-3% is average, 3%-5% is strong, and above 5% is exceptional [6]. Bluesky users often report 2–10× higher engagement compared to other platforms, partly because Bluesky doesn’t penalize posts with links [1]. This metric offers a clear view of what resonates with your audience, enabling smarter content strategies.
Total Engagement: Tracking Overall Activity
Total engagement tallies every like, repost, and reply your content receives, providing a snapshot of how active your audience is. Unlike engagement rate, this metric emphasizes the raw reach and impact of your posts. Each type of interaction - likes, reposts, replies - offers unique insights into audience behavior.
A study by Buffer analyzing 1.7 million posts in early 2025 found that while half of all posts across platforms received four or fewer engagements, average engagement varied widely: X averaged 328 engagements, Threads 58, and Bluesky 21 [2]. Bluesky’s lower average reflects its focus on fostering smaller, more engaged communities rather than chasing virality. With over 32 million accounts and more than 1 million daily posters [1], the platform prioritizes meaningful interactions.
Tracking total engagement over time can highlight standout content. For instance, if your typical post garners 20 interactions but one reaches 100, it’s worth examining what made that post successful. This metric helps pinpoint what works and informs future strategies.
Attention Scores and Sentiment Indicators
Sentiment analysis dives deeper, uncovering audience emotions behind the numbers. While engagement metrics count interactions, sentiment analysis reveals whether those interactions are positive, negative, or neutral. This matters because research shows 70% of customer decisions are driven by emotions, with only 30% influenced by logic [7].
Sentiment analysis uses natural language processing to evaluate comments, replies, and mentions. Tools like Talkwalker and Visibrain integrate with Bluesky to provide insights into tone, volume, and user sentiment [1][4]. Visibrain’s monitoring module even tracks impressions and brand mentions alongside sentiment data [4].
The key is to focus on trends over time rather than isolated comments. A single negative reply might not signal an issue, but a pattern of negative sentiment could indicate a need for strategy adjustments. Monitoring brand mentions across posts and replies provides a fuller picture of public sentiment [1].
Emily Liu, Bluesky’s Head of Special Projects, underscores the platform’s role:
"Bluesky has over 32 million accounts, with over 1 million daily posters and more than 1 billion posts created since its launch. We want Bluesky to be a place where users can both find the latest news and stay in touch with their friends, and we're excited to partner with Hootsuite to make it easier to tap into the Bluesky network." [1]
Analyzing Engagement Data for Actionable Insights
Raw engagement data by itself doesn’t lead to smarter decisions - it’s the analysis that turns numbers into meaningful strategies. In fact, research reveals that 77% of marketing ROI is driven by campaigns that are segmented, targeted, and triggered [9]. This kind of analysis lays the groundwork for precise audience segmentation and consistent data practices.
Using Data Segmentation to Improve Feedback
Engagement metrics become far more valuable when paired with audience segmentation. By breaking down your audience into smaller groups based on factors like demographics, behavior, and engagement preferences, you can pinpoint what type of content resonates with each group. This approach transforms raw data into actionable insights that guide your content strategy.
The results speak for themselves. Segmented email campaigns see a 30% boost in open rates and a 50% increase in click-through rates compared to non-segmented campaigns [10]. On a platform like Bluesky, this could mean tailoring technical content for developer followers while focusing on community updates for general users.
A good starting point for segmentation is behavioral analysis. For instance, developers might engage more with technical tutorials, while business professionals may prefer industry news. Understanding these preferences allows you to create content that feels relevant and personal to each segment.
Customer segmentation doesn’t just improve engagement - it keeps it fresh. Open rates can increase by 23%, and click-through rates by 49% when segmentation is done well [12]. However, audience preferences evolve, especially on a fast-growing platform like Bluesky, which now has 35.2 million users. Regularly updating your segments ensures you stay aligned with what your audience wants today - not six months ago.
Solving Data Standardization Challenges
Once you’ve segmented your audience, the next hurdle is ensuring consistency in how you track and analyze data. Without standardized methods, comparisons become unreliable and strategic decisions can falter.
Start by establishing clear rules for naming conventions and formatting. For example, always use the same date format (MM/DD/YYYY), stick to a single time zone (like EST or PST), and define engagement categories in a consistent way. Document these standards in a centralized plan that everyone on your team can access.
Maintaining data quality also requires schema enforcement and validation [11]. Set up validation rules to catch errors before they skew your analysis. For example, if engagement rate calculations depend on follower counts at posting time, make sure this method is applied uniformly across all your metrics.
Automation tools can simplify this process. Platforms like TheBlue.social’s analytics suite can automatically standardize data collection, reducing human error and ensuring consistent tracking for your Bluesky content performance.
Tables for Metric Comparisons
Different goals call for different metrics, and knowing which ones to focus on can make all the difference in shaping your content strategy.
| Content Goal | Primary Metric | Secondary Metric | When to Use |
|---|---|---|---|
| Community Building | Engagement Rate | Reply Count | Building loyal, active followers |
| Content Reach | Total Engagement | Repost Count | Expanding brand awareness |
| Audience Sentiment | Sentiment Score | Reply Quality | Understanding audience feelings |
| Viral Potential | Repost Rate | Share Velocity | Creating shareable content |
This framework helps you decide which metrics to prioritize based on your specific objectives. For example, if your goal is to build a strong community, you might focus on engagement rates and meaningful replies. On the other hand, a campaign aimed at increasing brand awareness would likely emphasize total engagement and repost counts.
When metrics don’t align with expectations, segmenting your audience can provide clarity [13]. For instance, if your overall engagement rate drops, breaking it down by audience segments might reveal whether the decline is widespread or limited to a specific group.
Ultimately, aligning your metrics with your strategic goals ensures your campaigns hit the mark. Audience segmentation allows you to deliver the right message to the right people at the right time [8].
Improving Engagement Insights with Bluesky Analytics Tools
Specialized analytics tools are changing the way you track and understand engagement metrics on Bluesky. As the platform continues to expand, having the right tools in your corner is essential for connecting with your audience and fine-tuning your content strategy. Let’s explore how TheBlue.social’s tools can help you achieve this.
Features of TheBlue.social for Engagement Analytics
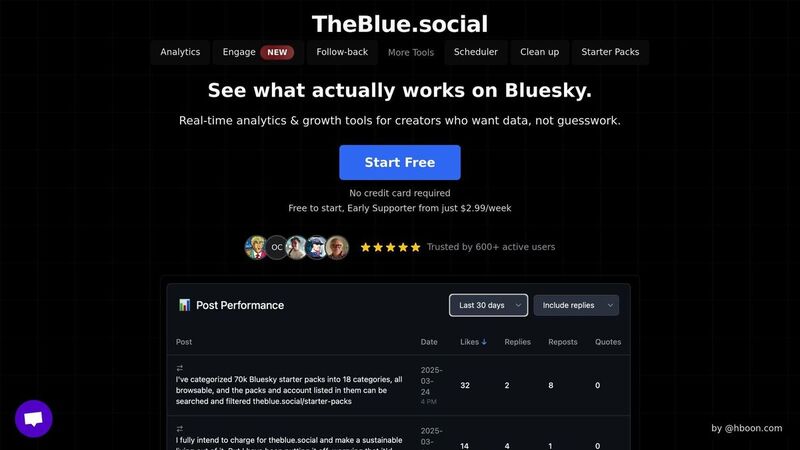
TheBlue.social's analytics platform provides a powerful set of tools designed to track engagement and deliver actionable insights. The platform goes beyond basic metrics, offering features like engagement tracking, follow growth monitoring, and a cross-posting scheduler, giving you a comprehensive view of your social media performance.
Here’s what it offers:
- Real-time Metrics: Track likes, reposts, and replies to identify which posts resonate most with your audience.
- Follow Growth Monitoring: Understand how your audience is growing and which types of content attract new followers.
- Cross-Posting Scheduler: Publish content simultaneously on Bluesky and X (Twitter) while comparing performance across both platforms.
- Community Exploration Tools: Features like following management and starter packs help you discover new communities and potential collaborators.
Most features are accessible through a free tier, while premium plans start at $10/month. Premium users gain higher limits and priority access to new features, making it an excellent option for creators and businesses looking to scale their efforts.
But the value of these tools goes beyond just tracking numbers - they can reshape your entire content strategy.
How Analytics Tools Improve Content Strategy
Analytics platforms like TheBlue.social turn raw data into actionable insights, helping you make smarter content decisions. By relying on performance data instead of guesswork, you can create strategies that are both targeted and effective. The platform’s automated data standardization ensures accurate, consistent tracking, making comparisons across campaigns easy and reliable.
Take Re-Work as an example. This organization used a social media analytics tool to analyze conversations about their events. The tool provided insights into geographical trends, identified influential voices, and highlighted emerging topics. These insights helped them make data-driven decisions to improve future events [14].
This level of analysis is crucial when you consider that 75% of B2B buyers use social media to inform their purchasing decisions [15]. Detailed analytics can reveal why certain content resonates with your audience and how it influences their behavior. For example, these tools can identify the best times to post or the formats that perform best based on historical data. Scheduling content during peak activity times can dramatically boost engagement and extend your reach.
Additionally, audience segmentation features allow you to tailor content for specific groups, ensuring your messaging hits the mark. For businesses or creators juggling multiple accounts, centralized dashboards provide a clear overview of performance across platforms. This bird’s-eye view makes it easy to see which channels are most effective for different types of content, giving you the confidence to adjust your strategy as needed.
Conclusion: Using Engagement Metrics for Feedback
Engagement metrics are your window into audience behavior on Bluesky. By analyzing likes, reposts, replies, and follower growth, you can pinpoint the type of content that truly connects with your community. This approach takes the guesswork out of content creation, turning it into a more strategic and informed process.
Publishers who join Bluesky often see a 2–10× jump in engagement within their first few weeks, even with a smaller follower count compared to older platforms [16]. With Bluesky's user base projected to reach 27.44 million by January 2025 and 3.5 million daily active users in the US and UK combined, the platform offers growing opportunities for meaningful interaction [18]. These numbers provide a clear incentive to refine your approach and make the most of the platform's potential.
Success on Bluesky hinges on regular monitoring and thoughtful adjustments. Use analytics tools to filter data by topics and keywords, helping you identify what drives engagement. Pay close attention to audience feedback and incorporate their suggestions to fine-tune your strategy. On Bluesky, authenticity carries more weight than chasing viral trends, as the platform prioritizes genuine creators over fleeting moments of virality.
Tools like TheBlue.social's analytics platform make this process easier by offering real-time metrics, follower growth tracking, and cross-posting features. Businesses that adopt data-driven strategies in social media often see 5 to 8 times higher ROI on their marketing efforts [17], making such tools a smart investment for growth.
FAQs
How does sentiment analysis provide deeper insights into audience feedback beyond engagement metrics?
Sentiment analysis digs deeper than simple engagement metrics by assessing the tone behind audience reactions. It classifies responses into positive, negative, or neutral, giving you insight into not just how much people are engaging, but how they actually feel about your content.
Recognizing emotional trends and patterns in feedback enables you to make smarter decisions, fine-tune your messaging, and create a stronger bond with your audience.
How can I boost my engagement rate on Bluesky and create content that connects with my audience?
To increase your engagement rate on Bluesky, focus on sharing content that resonates with your audience's interests and adds value to their experience. Posting during peak activity hours and actively interacting with your followers - whether through thoughtful comments or meaningful conversations - can strengthen connections and boost your visibility.
Use analytics tools to monitor your performance and adjust your approach as needed. Building a sense of community is key: follow others, join topic-specific feeds, and maintain a consistent posting schedule. Additionally, cross-promoting your Bluesky content on other platforms can expand your reach and help your message connect with a broader audience.
How can data segmentation help me create more personalized content, and what steps should I take to start segmenting my audience?
Data segmentation lets you tailor your content by breaking your audience into smaller groups with shared traits or behaviors. This approach helps you send targeted messages that connect better, increasing both engagement and relevance.
Start by collecting detailed audience information - things like demographics, preferences, and online activities. Use this data to identify patterns and create meaningful segments. To keep your strategies sharp, regularly revisit and adjust these segments as your audience's needs and habits evolve.
Last updated: July 21, 2025