Bluesky Analytics: Track Followers & Engagement
If you post on Bluesky and never check the numbers, you end up guessing. TheBlue.social helps with the plain questions: who followed, who unfollowed, which posts got replies or reposts, and when your posts tend to get liked.
Here’s what you can do with Bluesky analytics:
- Monitor Follower Growth: Track follower gains, losses, and historical trends for the account you connect.
- Evaluate Engagement: Measure likes, replies, reposts, and quotes to understand what resonates with your audience.
- Optimize Timing: Use heatmaps to discover when your audience is most active and schedule posts accordingly.
- Act on the data: Schedule posts across platforms, clean up your following list, use follow-back, and find starter packs when you want to rebuild or expand your network.
Whether you're growing a new account or trying to understand a messy one, TheBlue.social Analytics gives you enough signal to make better posting decisions.
Getting Started with TheBlue.social Analytics
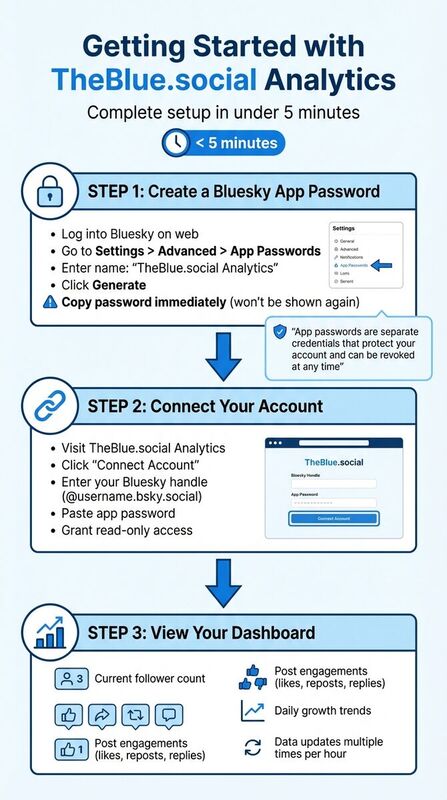 To monitor your Bluesky performance, connect your Bluesky account with TheBlue.social Analytics. The usual setup is quick: create a Bluesky app password, connect the account, then let TheBlue pull the metrics it needs.
Create a Bluesky App Password
An app password lets you connect TheBlue.social without sharing your main Bluesky password. It is separate from your normal login and can be revoked from Bluesky settings.
"For Bluesky, we use app passwords instead of your main password. App passwords are separate credentials that protect your account and can be revoked at any time." [6]
Follow these steps to generate one:
- Log into your Bluesky account on the web.
- Go to Settings > Advanced > App Passwords.
- Enter a name like "TheBlue.social Analytics" for easy identification.
- Click Generate and copy the password immediately - it won’t be shown again.
- Paste the password into TheBlue.social when prompted during the setup.
If you run into issues, double-check that you’ve copied the full password (without spaces), your handle is in the correct format (@username.bsky.social), and your cache is cleared. For more help, watch this tutorial or check if Bluesky is experiencing downtime using Is Bluesky Down?.
Once your app password is ready, you’re all set to connect your account.
Connect Your Bluesky Account
With your app password in hand, linking your Bluesky account is simple. Head to TheBlue.social Analytics, connect your account, enter your Bluesky handle, and paste the app password. The first sync usually starts quickly.
Your dashboard displays the metrics that matter for Bluesky: follower count, follows and unfollows, post engagement, likes, replies, reposts, and daily growth trends. If you connect more than one account, keep each one explicit so you know which account the numbers belong to.
Should you need to disconnect, simply go to Bluesky Settings > Advanced > App Passwords, find the TheBlue.social entry, and delete it. This will immediately revoke access, but you can reconnect anytime by creating a new app password.
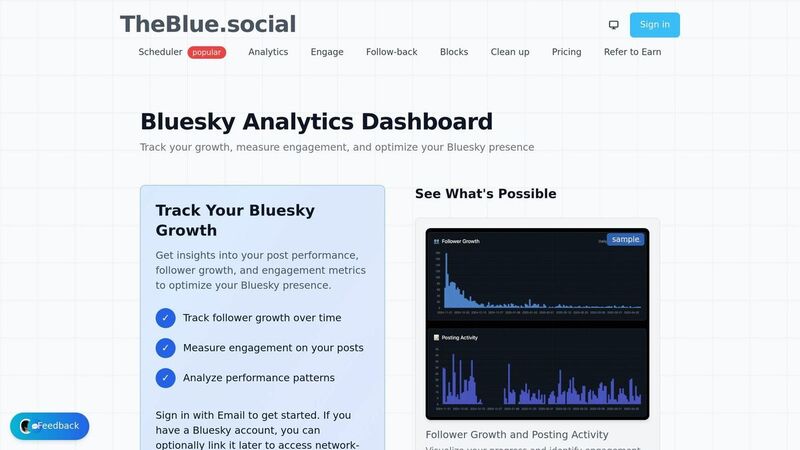
Monitoring Follower Growth
Once you connect your account, TheBlue.social's analytics dashboard shows how your Bluesky audience grows or shrinks over time. That matters because a flat follower count can hide churn: you may be gaining followers and losing almost as many on the same day.
View Real-Time Follower Data
Your dashboard doesn’t just show your total follower count - it breaks down the activity into new follows and unfollows. For example, if you gain 70 followers but lose 20 in a day, you’ll see both numbers clearly instead of just the net result. This level of detail can help you pinpoint whether specific posts are causing unfollows or if high churn rates are being hidden by new growth.
The follow/unfollow view is especially handy after a post gains traction or starts a stronger-than-usual conversation. You can quickly see whether the attention is turning into lasting audience growth or just a noisy day. For a broader view of the network, use Bluesky Network Statistics alongside your own analytics.
Review Historical Growth Patterns
Recent data is useful, but historical trends provide the bigger picture. Review your follower trajectory across the available time ranges and look for the plain patterns: steady growth, sudden churn, or a spike tied to a specific post. For instance, you might notice a jump in followers during a week of consistent posting, followed by a plateau during quieter periods.
Historical data also helps you connect follower changes to your content. A spike in followers after sharing a thread about Bluesky starter packs, for example, could indicate that educational posts resonate with your audience. On the flip side, a sudden drop might suggest that off-topic or polarizing content is driving people away.
Weekly email summaries help when you do not want to check the dashboard every day. They are a quick way to see whether growth, engagement, and follower changes moved in the right direction.
Measuring Engagement Metrics
Having a large follower count might look impressive, but it’s the engagement metrics - likes, replies, reposts, and quotes - that truly reflect how active and connected your audience is. For example, a post with 500 likes but zero replies might appear successful, but it hasn’t sparked any real conversation. By keeping an eye on all four metrics, you can go beyond surface-level numbers and get a clearer picture of how your content resonates. Here’s how to track performance and calculate engagement rates effectively.
Track Individual Post Performance
Your dashboard gives you a detailed breakdown of each post’s performance, showing the exact number of likes, replies, reposts, and quotes it received[5]. This level of detail allows you to spot patterns - like discovering that posts with open-ended questions tend to drive more replies. Pay special attention to quote-skeets, as they indicate a deeper level of interaction. When someone not only shares your post but also adds their own commentary, it shows they’re engaging on a more meaningful level[3]. Identifying these moments can help you fine-tune your content to encourage richer interactions.
Calculate Your Engagement Rate
Raw numbers can be misleading without context. For instance, 100 likes on a post mean something entirely different for an account with 500 followers versus one with 50,000 followers. TheBlue.social’s analytics tools allow you to compare post performance over different periods - such as 7, 30, or 90 days - so you can calculate engagement rates and identify which types of content consistently spark the most interaction[5].
After analyzing individual post metrics, it’s crucial to relate them back to your overall follower base. The platform also offers a "When Posts Get Liked" heatmap, which highlights the times your audience is most active[5][3]. This visual tool can help you pinpoint peak engagement periods. If the heatmap shows a clear pattern of high activity, you can adjust your posting schedule to align with these times and maximize engagement.
Using Analytics to Improve Your Strategy
Data matters when it changes what you do next. Use the dashboard to decide what to post again, what to drop, when to schedule, and which follower changes need a closer look.
Find Your Best-Performing Posts
The post metrics show engagement stats for each post. This helps you distinguish between one-off successes and posts that consistently perform well.
Pay close attention to posts with high reply counts, as they show deeper audience engagement [2]. If open-ended questions or visual posts regularly outperform others, lean into those formats. TheBlue.social also provides weekly growth reports that summarize your top-performing content [3]. Once you identify your strongest posts, the next step is figuring out the best times to share them.
Find the Best Times to Post
For audiences in English-speaking regions, peak engagement often occurs between 8–10 AM EST and 6–8 PM EST [2]. Compare your top-performing posts from the last week with your engagement heatmap to see if these time slots align with your audience’s habits. Use this information to schedule your most important content during these high-visibility windows.
Schedule Posts Across Multiple Platforms
TheBlue.social’s cross-posting scheduler supports Bluesky, X, Threads, Instagram, LinkedIn, Pinterest, and Mastodon. Use the analytics to decide what deserves another run, then adapt the post for each platform instead of copying it blindly. The Pro plan adds longer analytics history, which helps when you want to compare more than the last few days.
Free Tools to Support Your Bluesky Growth
Use the free tools around analytics when you need more context or a next action.
Bluesky Network Statistics
The Bluesky Network Statistics tool provides real-time data on the platform's activity. As of March 20, 2026, Bluesky boasts 43,239,314 users, with 2.603 billion total posts, 3.543 billion follows, and 14.365 billion likes. The platform grows by approximately 0.24 users per second, translating to 20,569 new users daily.
These stats can help you measure your performance. For instance, if you gained 50 followers last week while Bluesky added 144,000 new users, you're capturing around 0.035% of the new user base. Comparing your growth and engagement metrics to platform-wide activity can reveal opportunities. When Bluesky experiences growth spikes - often due to media buzz or updates - consider increasing your posting frequency to attract new users [4].
Follow-Back Tool
TheBlue.social's Follow-Back Tool identifies users who follow you but have not been followed back. It is useful when you want to turn follower growth into actual network building instead of treating analytics as a report you never act on.
Use it with judgment. Following everyone back is not the goal. The better workflow is to filter, skim profiles, and follow back people who fit the account you are trying to build.
Bluesky Handle Checker
The Bluesky Handle Checker ensures your desired username is available before you create an account or rebrand. With thousands of users joining daily, popular handles can disappear quickly. Securing your preferred username early helps maintain consistency across platforms.
TheBlue also has username checkers for Instagram, X, Threads, TikTok, Pinterest, and LinkedIn, making it easier to keep your handle consistent across the platforms you use.
Conclusion
Keeping track of Bluesky performance does not need a giant reporting setup. TheBlue.social shows the numbers I would check first: likes, replies, reposts, quotes, follower movement, and when posts tend to get liked.
The useful part is what you do with it. Pair analytics with follow-back, cleanup, starter-pack discovery, and scheduling, and you get a practical Bluesky workflow instead of a report you never act on.
These analytics directly inform your content strategy. Whether you’re just getting started on Bluesky or managing a well-established account, the ability to review 7-day, 30-day, and 90-day trends helps you identify patterns and adjust your approach. You can stick with the free plan for basic metrics or opt for the Pro plan at $20 per month for extended data history and higher limits.
Instead of relying on guesswork, use TheBlue.social's analytics to spot the post formats, topics, and timing that work for your account. Then use the scheduler and Bluesky tools to act on what you find.
Start by checking the last week. Find the posts that got replies, reposts, and follows. Then schedule the next week with those patterns in mind.
FAQs
Is TheBlue.social Analytics safe to connect to my Bluesky account?
Yes, TheBlue.social analytics tools are safe to use with your Bluesky account. These tools are built to help you monitor your performance and growth while prioritizing the security of your account.
What’s a good engagement rate on Bluesky for my follower count?
A good engagement rate on Bluesky often hinges on the size of your follower base. Typically, an engagement rate of 1-3% is seen as solid, with higher percentages indicating stronger audience involvement. Since engagement rates can differ, the key is to aim for steady growth and build genuine connections with your audience.
How can I tell if a specific post caused a drop in followers?
To figure out if a particular post caused a drop in followers, dive into your Bluesky analytics. Pay attention to how follower changes align with your posting activity. Focus on metrics such as likes, replies, and reposts. Then, compare these engagement trends to your follower growth (or loss) during the same time frame to uncover any patterns.
Last updated: June 20, 2026