Predictive Analytics for Bluesky Post Growth
Predictive analytics can help you predict how your Bluesky posts will perform before you even hit publish. By analyzing past engagement metrics - like likes, reposts, replies, and follower growth - you can make smarter decisions about what to post, when to post, and where to target your content for better results.
Key takeaways:
- Posts optimized with predictive analytics can boost engagement rates by 20–50%.
- Timing matters: Posts shared during peak hours (e.g., 8–10 PM ET) often see 2.5x more likes and reposts.
- Tools like TheBlue.social's Bluesky Analytics simplify data tracking and help identify trends, like which content types or emojis drive the most interaction.
By using your own data, you can uncover patterns - like image posts performing better in the evening or question-based posts earning 30% more engagement. Predictive models, even with basic tools like Google Sheets, can help forecast post performance and refine your strategy over time.
Why it works:
- Predictive analytics shifts your strategy from guesswork to data-driven decisions.
- It helps you focus on high-potential posts, saving time and resources.
- Real-time tools allow you to adjust to platform trends and audience behavior.
Start by collecting your engagement data, identifying patterns, reading Bluesky guides, and building simple models to predict outcomes. Use tools like heatmaps and emoji trackers to refine your approach and target the right communities. With consistent updates to your models, you’ll see measurable growth in engagement and followers, or even clean up your following list to improve your feed.
How Can Predictive Analytics Scale Social Media Efforts? - Social Media Business Playbook
Predictive Analytics Basics
Predictive analytics takes historical data and uses it to forecast how future posts might perform. By analyzing statistical patterns and applying machine learning, it helps you determine the best content types, optimal posting times, and trending topics. Essentially, it shifts your strategy from guesswork to a structured, data-backed plan.
Here’s how it works: First, you gather historical data from your posts. Then, you identify patterns, like the best times to post or the types of content that get the most traction. Using these insights, models are built to connect these patterns to measurable outcomes. Finally, predictions are applied to guide future decisions. On Bluesky, this could mean analyzing metrics like engagement rates, reach, or follower growth over periods like 7, 30, or 90 days to identify recurring trends. Let’s explore how this translates into actionable strategies for Bluesky creators.
What Predictive Analytics Means for Bluesky
For creators on Bluesky, predictive analytics transforms raw engagement data into actionable forecasts. It goes beyond simply reporting past performance - like “this post got 500 likes” - to predicting future outcomes. For example, it might suggest that posts with images shared at 8:00 PM EST will likely see a 30% engagement boost. This proactive approach allows you to anticipate audience preferences before hitting the publish button.
This is especially useful for niche communities and custom feeds (like #art), where engagement tends to be higher than on broader timelines. Tools such as TheBlue.social's Bluesky Analytics make it easier to track these specific trends, offering real-time data to refine your predictions.
The accuracy of these predictions is noteworthy. According to a Stanford study on Twitter data - relevant to Bluesky’s structure - machine learning models can predict post virality with 85% accuracy using factors like hashtags and posting times. This means you can confidently forecast which posts are more likely to perform well before they even go live. Armed with these insights, you’ll see why predictive analytics is an essential tool for Bluesky creators.
Why Bluesky Creators Should Use Predictive Analytics
When you have a reliable forecasting model, the benefits become clear. Predictive analytics makes it possible to target your audience more effectively by anticipating what they want to see. This can lead to engagement rate improvements of 20–50%, according to social media benchmarks. For example, analyzing when your followers are most active allows you to schedule posts during peak times - such as evenings for U.S. audiences - resulting in significantly better engagement than posting during quieter hours. These insights are tailored to your specific data, not just generic advice.
It also helps you make better use of your resources. Instead of producing multiple posts and hoping one succeeds, predictive models allow you to focus on high-potential content that’s more likely to drive growth. Creators who apply these strategies often see up to 2× follower growth by prioritizing predicted winners. In fact, 87% of marketers using predictive analytics report higher ROI, with average engagement increases of 15%, according to HubSpot's State of Marketing 2024 report [1].
In Q1 2024, Buffer's analytics team applied predictive modeling to Bluesky data for their client "TechDaily." By scheduling posts at 8:00 PM EST - identified as a peak engagement time - they increased reposts by 45% (from 120 to 174 per post on average) over three months. The model, trained on 5,000 historical posts analyzing elements like time, emojis, and links, led by Data Scientist Mia Lopez, also drove a 28% increase in followers, bringing the total to 15,000.
Getting started doesn’t have to be complicated. Free tools like TheBlue.social's Bluesky Stats let you export engagement data for analysis. Even basic tools like spreadsheets can help you identify patterns - for instance, which types of posts perform best on specific days. With simple regression models in Google Sheets, you can correlate post timing with metrics like likes and reposts - no advanced coding skills required.
How to Use Predictive Analytics on Bluesky
 Here's a step-by-step guide to applying predictive analytics on your Bluesky account.
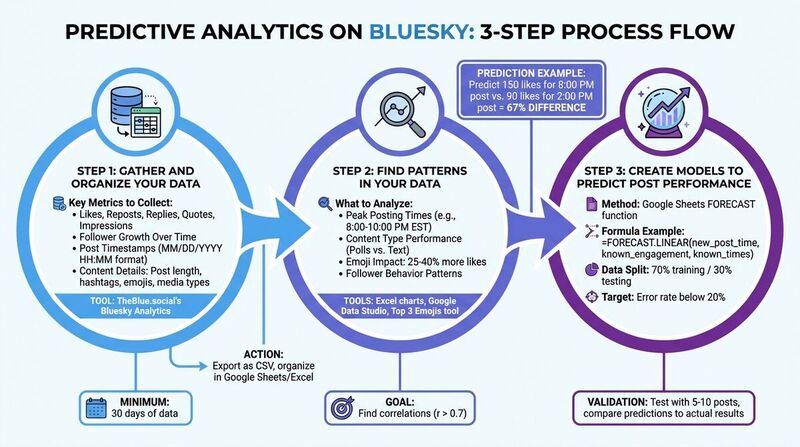
Step 1: Gather and Organize Your Data
Start by collecting key engagement metrics like likes, reposts, replies, quotes, and impressions for each of your Bluesky posts. Also, track follower growth over time and note the timestamps for when you post (use the MM/DD/YYYY HH:MM format). Pay attention to content details, such as post length, hashtags, emojis, media types (like images or videos), and interactions within custom feeds.
A tool like TheBlue.social's Bluesky Analytics can simplify this process by providing real-time insights into network-wide and personal engagement trends, follower growth, and post performance. You can export this data as a CSV file and organize it using tools like Google Sheets or Excel. Aim to analyze at least 30 days of data to identify patterns and engagement spikes.
Once you have the data, structure it in a spreadsheet with columns for post ID, timestamp, engagement metrics (e.g., likes, reposts), content type, and audience demographics. Clean your data by removing duplicates and outliers to ensure accurate pattern detection.
Step 2: Find Patterns in Your Data
With your data in place, start looking for trends that indicate what drives engagement. Use visualization tools like Excel charts or Google Data Studio to make sense of the numbers. For example, plot engagement metrics against posting times to uncover peak hours - maybe you'll notice that posts between 8:00 PM and 10:00 PM EST consistently perform better. Compare different content types, such as polls versus text-only posts, and analyze follower behavior to identify when reposts tend to spike.
One common trend is that posts with emojis often receive 25–40% more likes. Tools like TheBlue.social's Top 3 Emojis tool can help you identify which emojis are most effective. Cross-reference emoji usage with engagement metrics like repost rates to uncover patterns - certain emojis might boost replies by 15–20%. Focus on statistical correlations (e.g., r > 0.7) to pinpoint the most impactful trends for your predictive models.
Step 3: Create Models to Predict Post Performance
Once you've identified key trends, it's time to build predictive models. You can start with simple tools like Google Sheets' FORECAST function, using 90 days of historical data. For example, the formula =FORECAST.LINEAR(new_post_time, known_engagement, known_times) can help estimate future engagement - like predicting 150 likes for a post scheduled at 8:00 PM.
Begin with a straightforward linear regression model. Test its accuracy by splitting your data - use 70% for training and 30% for testing - and aim for an error rate below 20%. As you refine your approach, experiment with different splits (e.g., 80/20) and more advanced models like decision trees to predict engagement based on content type. Validate your predictions by posting 5–10 times and comparing actual results to your forecasts. If the outcomes don't match, consider running A/B tests to fine-tune your model. And don't forget to check platform stability using tools like Is Bluesky Down? to rule out external factors affecting engagement.
Applying Predictions to Your Bluesky Strategy
Take your predictive insights and use them to fine-tune your posting times, focus on the right communities, and adapt as engagement trends evolve.
Post When Your Audience is Most Active
Timing is everything. By identifying when your audience is most engaged - like 8:00–10:00 PM EST on weekdays - you can schedule posts 30–60 minutes earlier to give them the best chance of being seen.
Tools such as TheBlue.social's Bluesky Analytics offer "When Posts Get Liked" heatmaps, which visually map out the hours and days that generate the most engagement for your account. Analyzing data over 7, 30, and 90-day periods can reveal seasonal trends. For example, summer weekends might outperform weekdays, or morning posts might gain traction during major events. If your model predicts 150 likes for an 8:00 PM post but only 90 for a 2:00 PM post, acting on that 67% difference can significantly boost your visibility. To confirm these predictions, test 5–10 posts during peak times and measure the results.
Once you’ve nailed the timing, focus on reaching the right communities.
Reach the Right Communities and Custom Feeds
Bluesky's custom feeds are a powerful way to connect with specific audiences. Use your predictive analysis to determine which feeds generate the most engagement for your content type. For instance, if your data shows that tech-related posts get 2–3 times more reposts in certain feeds, prioritize those. One creator discovered that sharing AI tips in the "Bluesky Dev" custom feed led to 40% more follows compared to general posts.
Dive into your past high-performing posts and use topic modeling to predict which feeds will respond best. If posts with specific keywords consistently average 200+ likes, look for feeds centered around those topics. Tools like the Top 3 Emojis tool can also uncover patterns - perhaps posts featuring 🚀 or 💡 resonate more in innovation-focused feeds. Pair emoji trends with engagement metrics to zero in on the communities most likely to amplify your content.
Finally, keep refining your approach by staying on top of real-time engagement data.
Adjust Your Strategy Based on Current Data
A winning strategy isn’t static - it evolves. Update your predictive models regularly to account for changes in audience behavior. Models can lose accuracy over time, so retrain them every two weeks or after significant platform updates. Use tools like Bluesky Analytics, which refreshes data multiple times per hour, to track real-time metrics like likes, reposts, and follower growth.
Set clear triggers for adjustments. For example, if your predicted engagement drops by 15% or more for three consecutive posts, it’s time to refresh your data and rebuild your model. Weekly performance reviews can help you catch shifts early. If your 8:00 PM posts suddenly underperform while 6:00 PM posts gain traction, adjust your schedule immediately. Use Bluesky Network Statistics to benchmark your performance against platform-wide trends and factor in external influences like viral events or outages that might skew your data.
Using TheBlue.social Tools for Predictive Analytics
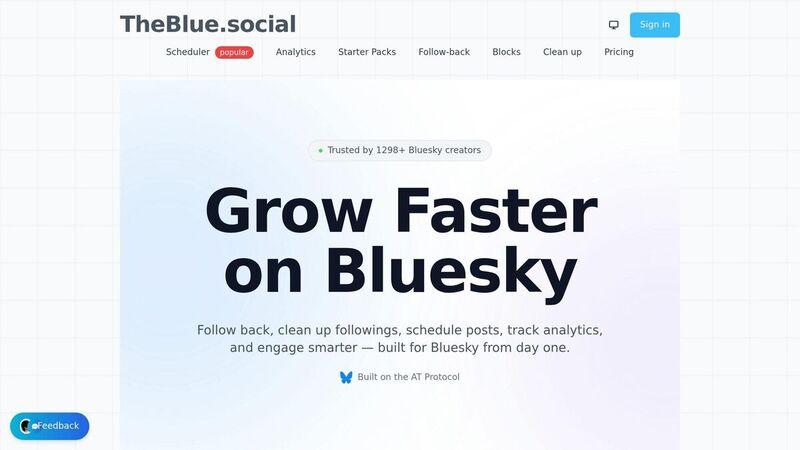
TheBlue.social offers a suite of tools designed to supercharge your predictive analytics for Bluesky. These tools help you collect, analyze, and apply data to refine your content strategy.
Track Engagement with Bluesky Analytics
With TheBlue.social's Bluesky Analytics, you can monitor key metrics like likes, replies, reposts, and quotes - essential data points for building predictive models. The platform also tracks follower growth, uncovering patterns that can guide your posting strategy. Since the data refreshes multiple times per hour, you gain near real-time insights to adjust your approach on the fly.
One standout feature is the "When Posts Get Liked" heatmap, which shows exactly when your content gets the most engagement. This tool helps you pinpoint the best times to post by analyzing trends over the past 7, 30, or 90 days. For example, you might discover that summer weekends outperform weekdays or that morning posts perform better during specific events. Weekly growth reports delivered via email summarize your top-performing posts, follower trends, and other key insights, keeping you informed without extra effort.
Free Tools for Data Analysis
TheBlue.social doesn't stop at basic analytics - it also offers free tools to deepen your analysis. The Bluesky Network Statistics tool provides real-time data on platform-wide trends, such as active user peaks and trending topics across Bluesky's 35.2 million users. For instance, if network stats reveal a 40% spike in activity on Saturday evenings, you can align your posting schedule to match these patterns, combining personal insights with broader trends for better predictions.
Another useful tool is My Top 3 Emojis, which analyzes your post history to identify emojis that drive higher engagement. If 🚀 or 💡 posts consistently see 15–25% more likes, you can use this information to shape future content. Pair this with follower management tools like "Follow-Back" and "Clean Up Followings" to curate a more engaged audience - leading to higher-quality data and more accurate predictive models. These tools make it easier to manage content and refine your strategy across platforms.
Manage Content Across Platforms with Cross-Posting
Predictive analytics become even more powerful when combined with TheBlue.social's post scheduler. This tool simplifies cross-posting, letting you manage content across Bluesky, X, Threads, Instagram, LinkedIn, Pinterest, and Mastodon from one dashboard. Use insights like best-time recommendations from heatmaps to schedule posts for peak activity times. The scheduler also formats long posts and generates AI-powered alt text to improve accessibility and engagement. Plus, with a free forever plan that requires no credit card, you can start tracking analytics and testing predictive models without any upfront commitment.
Conclusion
Predictive analytics transforms uncertainty into clear, actionable decisions. By using data-driven predictions, creators can significantly improve engagement and grow their follower base and manage connections with a Bluesky Follow Back Tool. In fact, those who focus on optimizing timing and targeting the right feeds often experience 20-50% increases in visibility and follower growth.
Tools like TheBlue.social make this process easier. Their Bluesky Analytics dashboard provides engagement metrics that update multiple times per hour, while the "When Posts Get Liked" heatmap highlights the most active times for your audience. Plus, free tools such as Bluesky Network Statistics and My Top 3 Emojis help uncover trends - like how specific emojis can boost interaction rates by 15-25% - without needing complex software.
For ongoing success, it’s essential to combine predictive models with up-to-date platform data. Since Bluesky’s decentralized feeds change quickly, refreshing your models weekly with real-time analytics helps maintain strong engagement. The cross-posting scheduler also allows you to test predictions across platforms, refine your strategy, and focus on what delivers results. By consistently applying these methods, you can turn insights into measurable growth.
FAQs
What’s the simplest predictive model I can build in Google Sheets for Bluesky posts?
A straightforward way to build a predictive model in Google Sheets is by tracking engagement metrics over time to spot patterns. Start by logging key details like post dates, times, and engagement stats (such as likes, replies, reposts, and quotes).
Once you have this data, you can use built-in formulas like AVERAGE to calculate typical engagement levels or LINEST to identify trends over time. These tools help you analyze historical performance and make educated guesses about the best times to post or the types of content that resonate most with your audience.
This method keeps things simple - no need for advanced tools - while still leveraging past data to improve engagement strategies.
How much historical Bluesky data is needed for reliable predictions?
To make dependable predictions, you’ll need several months of consistent Bluesky data. This allows you to spot important growth patterns, track engagement trends, and determine the best times to post. Make sure the data reflects enough user activity to provide insights that matter.
How can I keep my predictions accurate as Bluesky trends evolve?
To keep your predictions accurate as Bluesky trends shift, it's essential to work with real-time data rather than depending only on past patterns. Tools that track metrics like likes, reposts, replies, and follower growth can provide valuable insights. These metrics reveal changes in audience behavior, helping you fine-tune your strategy. By staying alert to trends and adjusting your content, timing, and overall approach, you'll stay relevant and boost engagement effectively.
Last updated: May 2, 2026