Ultimate Guide to Cross-Platform Content Analytics
Last updated: June 16, 2026
Cross-platform analytics gets messy because every platform names and counts things differently.
I would not compare native dashboards directly. Standardize the few metrics that matter, tag links consistently, and use a reporting view that shows where content creates traffic, signups, or sales.
Track this first:
- Impressions and reach for awareness.
- Engagement rate for resonance.
- Click-through rate for traffic.
- Conversions for business results.
- Audience growth for long-term momentum.
How to build your cross channel marketing analytics platform within 30 minutes - NO SLIDES
Key Metrics for Cross-Platform Content Analytics
Core Metrics to Track
When analyzing content across platforms, start with the goal. Tracking the wrong numbers creates busy dashboards and bad decisions. I group metrics into four buckets: awareness, engagement, traffic, and conversions.
For awareness, impressions and reach are your go-to metrics - they show how far your content spreads. Engagement is measured by combining likes, comments, shares, and saves into an engagement rate. A consistent formula to use across platforms is:
(total engagements ÷ impressions) × 100.
This method ensures consistency, avoiding discrepancies caused by platform-specific calculations.
For traffic, prioritize link clicks and CTR (calculated as link clicks ÷ impressions × 100). These metrics reveal how effectively your content drives users to external sites. When it comes to conversions, UTM-tagged URLs are essential. By integrating these with tools like Google Analytics 4, you can directly link social activity to business outcomes like sign-ups or sales.
Track audience growth too. Use net follower change over time and calculate growth rate as:
(new followers ÷ starting followers) × 100.
Spikes in growth often point to specific posts or campaigns that resonate with your audience.
One metric to prioritize over likes is saves and shares. These actions indicate deeper interest and are more likely to boost algorithmic reach and lead to conversions than passive reactions.
How to Set Benchmarks Across Platforms
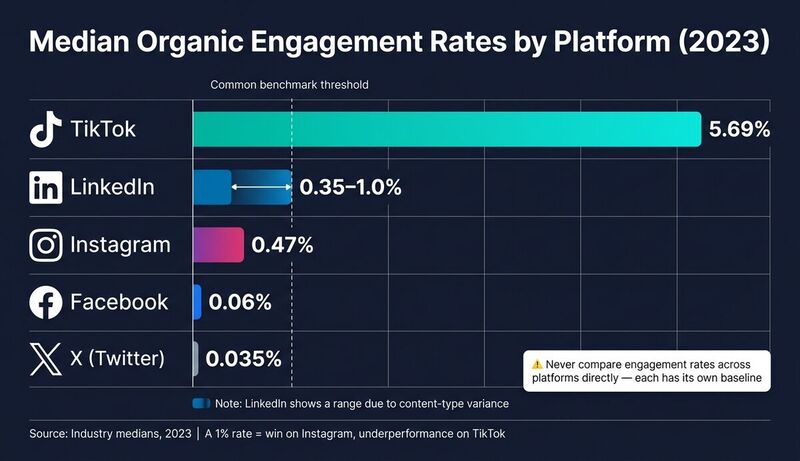
Benchmarks only matter when they're grounded in both your historical performance and platform-specific norms. Industry medians can vary widely:
| Platform | Median Organic Engagement Rate (2023) |
|---|---|
| TikTok | ~5.69% |
| ~0.47% | |
| ~0.35-1.0% | |
| X (Twitter) | ~0.035% |
| ~0.06% |
These numbers are why direct platform comparisons are often wrong. A 1% engagement rate can be strong on Instagram and weak on TikTok.
To set benchmarks, analyze 3-12 months of your own data for each platform. Calculate the median and 75th percentile for impressions, engagement rate, and CTR. Use industry benchmarks as context, not as your target. Segment by content type and funnel stage so an awareness post is not judged like a sales post.
Turning Data into Actionable Insights
Metrics alone do not improve content. The useful part is connecting each metric to a business goal:
- Impressions and reach: Are we building awareness?
- Engagement rate and saves: Is the content resonating?
- CTR and conversion rate: Is it driving action?
When performance changes, find the cause. Was it format, timing, call-to-action, topic, or platform? If a LinkedIn post with a direct question gets a 6% engagement rate against a 2% baseline, test that pattern again before calling it a strategy.
Prioritize high-intent signals like comments or saves over passive actions like likes. A comment such as "Is this available in the U.S.?" or a save on a product post is far more valuable for predicting conversions. Focus your efforts on these behaviors to identify the platforms and content that truly drive results.
Tools and techniques for cross-platform analytics
Analytics Tools Worth Using
To effectively manage cross-platform analytics, think of it as a three-layered system:
- Platform Analytics: LinkedIn, Instagram, X, Pinterest, and other mature platforms provide native analytics for post engagement. Bluesky needs a third-party or API-derived layer if you want a practical analytics view. Either way, these tools operate in isolation, making it hard to see the bigger picture.
- Web Analytics: Tools like Google Analytics 4 (GA4) bring another dimension by connecting social activity to actual outcomes on your site, such as signups, downloads, or purchases. GA4's event-based tracking makes it much better at linking social posts to user actions than earlier versions.
- BI Dashboards: Platforms like Looker Studio, Tableau, or Power BI allow you to combine data from various sources for side-by-side comparisons. This step is critical for building a comprehensive view of performance across all platforms.
If Bluesky is part of your strategy, TheBlue.social can help with the Bluesky layer. Bluesky Analytics tracks engagement and follower growth, while the cross-posting scheduler helps adapt and publish posts across X, Threads, Instagram, LinkedIn, Pinterest, Bluesky, and Mastodon. It is not a replacement for GA4, native exports, or a BI warehouse.
According to the 2024 Sprout Social Index, 92% of marketers use more than one social platform, with 58% juggling between 4 and 9 at a time. At that scale, relying solely on native dashboards quickly becomes overwhelming.
Setting Up Tracking and Data Sources
Before comparing platforms, fix tracking. UTM parameters tell you where clicks come from. Every social link should use the same naming convention. If one person uses linkedin, another uses LinkedIn, and another uses ln, GA4 will split one channel into three rows.
Next, define conversions clearly. Whether it is a newsletter signup (sign_up), demo request (lead_form_submit), or whitepaper download (download_whitepaper), event names and triggers should stay consistent. Keep a small event dictionary with each event name, trigger, and business goal. A shared spreadsheet is enough.
Centralizing Data from Multiple Platforms
Once tracking is consistent, the next step is unifying data from all platforms. The goal? A single reporting view that consolidates metrics like reach, engagement rate, clicks, sessions, and conversions - without weekly manual spreadsheet work. Centralized data not only saves time but also makes it easier to uncover actionable insights.
For smaller teams, tools offering built-in multi-platform reports might suffice. However, for more advanced needs, data connectors like Supermetrics or Funnel.io can pull API data from social platforms into dashboards like Looker Studio or Power BI. This creates a live, filterable view of your data, enabling comparisons by platform, date range, campaign, or content format.
A useful dashboard answers three questions quickly:
- Which platforms drive the most reach?
- Which ones convert best?
- Which content formats beat benchmarks?
If it cannot answer those, simplify it.
Best practices for cross-platform content analytics
To make the most of your tracking and reporting efforts, it's essential to adopt practices that keep your analytics accurate and actionable.
Keeping Data Collection Consistent
Even with a solid tracking setup, inconsistency in data collection can undermine your cross-platform analytics. The real issue isn't missing data - it's when inconsistent tagging causes your tools to misinterpret the information.
For example, if one person tags a LinkedIn post as linkedin, another uses LinkedIn, and someone else opts for ln, your reporting tool will treat these as separate channels. Over time, this inconsistency can skew your data.
To avoid this, create an Analytics Playbook - a shared document that standardizes UTM parameters, naming conventions, and content taxonomy. For instance, every social media link should follow the same UTM structure:
utm_source: The platform (e.g.,instagram,linkedin,bluesky)utm_medium: Always set tosocialutm_campaign: A standardized campaign nameutm_content: A descriptor for the post, likevideo-how-to-01
When content is cross-posted, use the same utm_campaign and utm_content values across platforms. This ensures you can easily compare performance in tools like GA4.
Additionally, tag posts with three key attributes: business objective, funnel stage, and content topic. Keep those labels in your campaign sheet, UTM convention, or reporting tool. When using TheBlue.social's cross-posting scheduler, carry the same campaign language into the post draft and links so the published content matches the reporting plan.
Using Analytics to Improve Content
Once your data is clean and consistent, you can start using it to refine your content strategy. A simple framework - Metrics → Diagnosis → Action - can guide your approach.
- Low reach: If your posts aren't reaching enough people, the issue might be a weak hook or poor timing. Experiment with the first few seconds of your video or the opening line of your copy. Also, try posting during peak U.S. hours, such as 8-10 a.m. PT or 9-11 a.m. ET.
- Low engagement despite good reach: If people are seeing your content but not interacting, it's likely not resonating. Include clear calls-to-action (CTAs) like "Save this for later" or "Reply with your take." Focus on audience-centered language - use "you" instead of "we" to make your messaging more relatable.
- Low CTR on link posts: If clicks are low, the problem might lie in the copy or the link preview. Use tools like TheBlue.social's Open Graph OG Preview Tool to check how your link thumbnail and description appear on platforms like X, LinkedIn, and Threads before publishing.
Document every change you make with "Before vs. After" notes. This helps you identify what works so you can replicate successful strategies across platforms while avoiding past mistakes.
Data Quality and Governance
Clean data does not stay clean by itself. Outdated campaign names, duplicate tags, and inconsistent metric definitions creep in over time.
To prevent this, conduct a weekly spot check. Review 10-20 recent posts to ensure UTMs, tags, and naming conventions are accurate. If you find an error rate higher than 10-15%, address the root cause - update templates or improve onboarding processes - rather than fixing individual errors manually.
Assign an Analytics Owner to oversee the playbook, approve new campaign names, and maintain a changelog for tracking updates or changes. Limiting who can edit dashboards or source mappings also helps prevent unintentional disruptions.
Finally, perform a quarterly taxonomy audit. Use this time to retire outdated labels, consolidate duplicate tags, and verify that your metric definitions align with current platform APIs. This step is increasingly important as platform APIs and attribution windows continue to evolve.
Building reporting and optimization workflows
Effective analytics rely on workflows that transform clean, consistent data into actionable decisions. By building on the solid data practices previously discussed, these workflows ensure you're continuously gaining insights that drive results.
Setting Up Repeatable Reporting Processes
The purpose of a repeatable reporting process isn't to churn out endless reports - it's about delivering the right information to the right people at the right time.
Start by identifying 3-7 core KPIs that directly tie to business outcomes, not just surface-level metrics. For instance, a U.S.-based e-commerce brand might prioritize metrics like total sessions from social media, add-to-cart rates, and revenue per platform. These are far more actionable than simply tracking follower counts or impressions.
Use the same layout every time: same chart order, same filters, same colors. Green for above target, red for below target, gray for neutral. Looker Studio, Power BI, or Google Sheets can all do this.
For teams using X, Threads, Instagram, LinkedIn, Pinterest, Bluesky, and Mastodon, consolidate data into one master sheet or BI tool. If you use TheBlue.social for cross-posting and Bluesky analytics, combine that data with the other platform exports.
Automation doesn't have to happen all at once. Many smaller teams benefit from starting with structured manual reporting - using standardized spreadsheets with fixed tabs for raw data, calculated metrics, charts, and summaries. Once your process is solid, you can gradually introduce API connectors or more advanced BI tools.
Running Regular Performance Reviews
Having a reporting process is just the beginning. Regular reviews are where raw data becomes meaningful strategy. Without them, you're left with a pile of numbers and no clear direction.
For most U.S.-based marketing teams, a practical review schedule might look like this:
- Weekly tactical reviews (30-45 minutes): Focus on platform performance, content experiments, and priorities for the coming week.
- Monthly strategic reviews (60-90 minutes): Dive into trends, benchmark progress, and budget considerations.
- Quarterly deep dives (half-day sessions): Address major strategic shifts and long-term plans.
A typical weekly review might start with a quick five-minute recap of monthly goals. Spend the next 10-15 minutes examining top-line metrics compared to benchmarks and the previous period. Then, review the top and bottom three to five posts across platforms, analyzing factors like content type, creative approach, timing, or calls to action. Wrap up with clear action items assigned to specific team members.
Teams do not need a huge meeting to make this work. They need one owner, one dashboard, and a short list of decisions to make every week.
The review should produce decisions, not observations. Instead of "Bluesky is driving the highest engagement rate", decide: "Move 20% of long-form posts to Bluesky next month and track whether link clicks improve."
Updating Benchmarks and Goals Over Time
Consistent data collection lays the groundwork for meaningful benchmarks, but benchmarks aren't set in stone. Shifts in platform algorithms, audience behavior, and content trends can make last year's targets outdated - either too easy or completely unrealistic.
Use a rolling 90- or 180-day window to set benchmarks, updating them quarterly. During these updates, review whether your metric definitions still align with platform APIs. Even small changes in attribution windows or native metric calculations can subtly impact your reporting.[1]
Do not track only total follower counts. Monitor follower growth velocity to see how quickly the audience is expanding. Engagement heatmaps can show when posting times shift. Tools with "best-time" recommendations based on your audience's activity can help tune the schedule.
Conclusion and Key Takeaways
Key Points from This Guide
Cross-platform analytics works when it changes what you do next.
A viral X post with no conversions may be less useful than a quiet LinkedIn post that drives demo requests. A Bluesky post with fewer impressions may still be worth more if it gets replies from the people you want to reach.
Keep the system small: consistent UTMs, a few shared KPIs, a weekly review, and one place where the data is compared.
Next Steps for Readers
Start by listing your publishing platforms and picking one primary goal for the next 90 days. Choose three to five metrics that support that goal. Standardize UTMs. Log weekly results.
If you manage several platforms, use a scheduling tool such as TheBlue.social for cross-posting, Bluesky-specific analytics, the Open Graph preview tool, and the alt-text generator.
FAQs
What KPIs should I standardize across all platforms?
To create consistency in KPIs across platforms, zero in on metrics that measure performance and engagement. Key indicators include follower growth rate, engagement rate (likes, comments, shares, replies), reach, impressions, and click-through rate (CTR). These metrics provide insight into audience growth, how well your content connects with viewers, and overall visibility.
Tracking these regularly - ideally on a weekly basis - can help you spot trends and fine-tune your strategies as needed. Using consolidated dashboards simplifies comparisons across platforms, ensuring a consistent and data-driven approach to managing your content.
How do I set up UTMs to keep GA4 attribution clean?
To keep your GA4 attribution clean when using UTM parameters, stick to these practices:
- Stick to consistent naming conventions: Use clear and uniform tags, such as
utm_source=bluesky,utm_medium=social, andutm_campaign=fall2025launch. This makes your data easier to interpret. - Avoid overlapping or inconsistent tags: Ensure every campaign is tagged with unique and descriptive parameters to prevent confusion.
- Review and tidy up your data regularly: Check for duplicates and standardize formats to maintain accurate and actionable insights.
These steps help prevent errors in attribution and ensure your reporting stays dependable.
How often should I update benchmarks and reporting goals?
Review tactical performance weekly. Update benchmarks monthly or quarterly, depending on posting volume. During a launch or campaign, check daily because timing and creative changes can matter immediately.