Data-Driven Content Optimization for Bluesky
Want better engagement on Bluesky? Start with data. Bluesky, with 44 million users, focuses on chronological feeds and engagement-driven discovery. To stand out, you need to analyze metrics like likes, reposts, and replies. Posts with images see 40% more engagement, and timing matters - peak hours can boost reach by 40%. Tools like TheBlue.social make it easy to track performance, find the best posting times, and refine your strategy with Bluesky guides. Use features like heatmaps, hashtag generators, and weekly reports to create posts that connect with your audience. Start optimizing today for better results.
Tracking Content Performance with Analytics
Connecting Your Bluesky Account to TheBlue.social
To get started, sign in at TheBlue.social using your email or Google account. Once you're in the analytics dashboard, click on "Connect Bluesky Account", enter your handle, and create an app-specific password following the steps outlined in this guide.
After connecting, your post history and engagement data will automatically refresh several times per hour, covering the past 30 days. All your data stays private. With your account linked, you’re ready to dive into the key metrics that showcase how your content is performing.
Key Metrics to Monitor
Once your data is synced, keeping an eye on these metrics can help you refine your content strategy.
TheBlue.social focuses on four main engagement metrics: likes, reposts, replies, and quotes. Each one offers a unique perspective:
- Likes indicate overall approval.
- Reposts show content that others find worth sharing, which broadens your reach.
- Replies highlight posts that spark conversations.
- Quotes reflect posts that inspire others to add their own commentary.
The engagement rate is one of the most telling metrics. It’s calculated by dividing total interactions by impressions and multiplying by 100. For example, if a post gets 12 interactions (likes, reposts, and replies combined) from 200 impressions, the engagement rate is 6%. Most Bluesky users average 2-5%, while top creators often exceed 10%. Posts consistently achieving a 3-5% engagement rate can lead to follower growth of 5-10% per month.
Impressions - or how many times your post is seen - track your content’s reach. For instance, a post with 10,000 impressions compared to one with 1,000 has significantly more viral potential. Keep an eye on follower growth alongside post performance. Spikes in new followers often align with high-engagement posts. TheBlue.social’s dashboard visually overlays these metrics, making it easy to see which content types are drawing in new followers.
By analyzing these metrics, you can identify trends and figure out which posts resonate most with your audience.
Finding Your Top-Performing Content
To pinpoint your best content, head to the "Posts" tab in TheBlue.social analytics dashboard. Sort your posts by engagement rate or total interactions in descending order. You can also filter by date range (last 7, 30, or 90 days), content type (text, images, threads), or posting time. Sorting this way can reveal patterns - for example, question-based posts like "What's your favorite Bluesky feature?" might average 8% engagement, while announcement posts may only get 2%.
The "When Posts Get Liked" heatmap is another valuable tool. It shows when your audience is most active. If posts shared in the evening (7-9 PM ET) consistently get three times more reposts than morning posts, that’s actionable insight. Look for trends in your top 10 posts. Do threads with images perform better than text-only posts? Does adding emojis (check out the emoji stats tool) boost impressions by 20%?
For ongoing insights, enable weekly growth reports via email. These summaries highlight your top-performing posts, new followers, and engagement trends, helping you stay informed without needing to check the dashboard daily. If you want to dig deeper, export your analytics data into spreadsheets to uncover patterns - like whether posts with AI-generated alt text (generate image alt text here) tend to reach a wider audience.
Optimizing Content Strategy with Data Insights
Finding the Best Times to Post
Your performance data is a goldmine when it comes to fine-tuning your content strategy for Bluesky's engagement-driven algorithm. Once you've pinpointed your top-performing posts, the next step is figuring out the best times to share them. Timing is crucial - Bluesky's algorithm prioritizes engagement signals like likes, reposts, and replies, especially within the first few hours after a post goes live. That means the right timing can significantly impact your content's visibility.
Tools like TheBlue.social's "When Posts Get Liked" heatmap make this process easier by showing when your audience is most active. Posts shared during these peak times can achieve up to 40% higher reach compared to those posted during quieter periods. Using a scheduler to align your content with these high-engagement windows is a smart move.
It’s also important to compare short-term (7-day) and long-term (90-day) engagement data. This helps you identify shifts in audience behavior over time. For example, as your audience grows or seasonal trends come into play, your optimal posting times might change. You can also find new audiences by exploring Bluesky starter packs relevant to your niche. These insights are a great foundation for refining other aspects of your content strategy.
Improving Content Accessibility and Discoverability
Making your content accessible isn’t just about inclusivity - it also helps it perform better within Bluesky's algorithm. For instance, adding alt text to your images not only broadens your audience but can also boost shares by about 15%.
TheBlue.social's Alt Text Generator simplifies this process by automatically creating descriptive text for your images. This ensures your posts are accessible while also helping Bluesky's algorithm better understand your visual content. Hashtags are another essential tool for discoverability. The Hashtag Generator suggests 3–5 relevant tags for your posts, which can increase your reach by 12–18% when used effectively. The key here is to focus on quality over quantity - overloading your posts with hashtags can dilute their impact. Track which hashtags drive the most interactions and adjust your strategy as needed.
Once your content is accessible and easy to find, consider adding interactive elements to further increase engagement.
Adding High-Engagement Elements
Small tweaks to your posts can have a big impact on engagement. For example, using emojis can increase engagement by about 25%. TheBlue.social's Emoji Stats tool can help you identify which emojis resonate most with your audience and which ones drive the best responses.
Beyond emojis, asking questions in your posts is a great way to spark conversations and encourage replies, which are critical engagement signals for Bluesky. Questions and polls have seen a 35% increase in popularity year-over-year on decentralized platforms. Instead of making a simple statement like, "We just launched a new feature", try asking, "What’s the first thing you’d do with our new feature?" This approach invites dialogue and boosts engagement.
To make this process even easier, use the Add Emojis tool to suggest relevant emojis for your posts. However, always cross-check with your Emoji Stats to ensure you're using the ones that click with your audience. By combining elements like 1–3 carefully chosen emojis, a direct question, and 3–5 targeted hashtags, you can aim for a 10% engagement increase with each iteration of your content strategy.
Testing and Refining Your Strategy
A/B Testing with TheBlue.social Scheduler
Once you have some data insights, it's time to fine-tune your approach by testing different strategies. TheBlue.social's post scheduler makes this process straightforward, allowing you to plan and schedule posts or threads in advance. This feature is perfect for comparing various content formats side-by-side.
For instance, you can use the "When Posts Get Liked" heatmap to experiment with different posting times. You might find that posts published during high-traffic hours get much better engagement than those shared during quieter periods.
It's also worth testing different content formats. Try comparing a single post with a detailed thread crafted using the platform's automatic thread-stitching tool. Use the analytics dashboard to track key engagement metrics like likes, replies, reposts, and quotes. This will help you identify which format resonates most with your audience. You can also experiment with accessibility features and other variations, using the near real-time feedback from analytics to guide your decisions.
These tests aren't just about short-term wins - they lay the groundwork for a strategy that adapts and improves over time.
Tracking Results and Making Adjustments
Once you've run your tests, the next step is to measure the outcomes. TheBlue.social's Weekly Growth Reports, delivered straight to your inbox, are a great way to start. These reports highlight what worked well over the past week, helping you identify the content types that resonate best with your audience.
For a broader perspective, use the analytics dashboard to toggle between "Last 7 days", "Last 30 days", and "Last 90 days" views. Short-term trends are easier to spot in the 7-day view, while the longer timeframes can uncover patterns of sustained growth. These insights can help you decide when to adjust your posting frequency or explore new content themes.
Keep a detailed record of how specific changes impact your core metrics. For example, does including a question in your post lead to more replies? Does tweaking the posting time result in more reposts? By tracking these details and integrating the successful tactics into your routine, you'll develop a strategy that's grounded in data and evolves with your audience's preferences. And don’t forget to periodically clean up your followings to maintain accurate results.
How to See Analytics on Bluesky Social with GraphTracks #bluesky #socialmedia #stats
## Using Free Tools for Better Results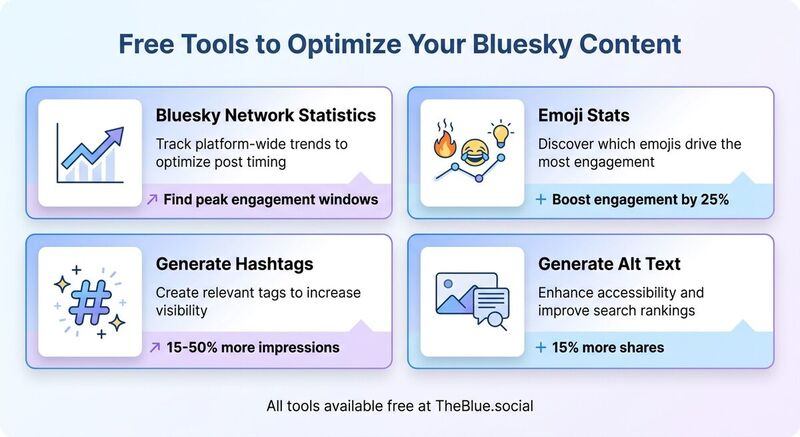
Comparing Key Tools for Optimization
Free tools can be a game-changer when it comes to refining your Bluesky strategy. While analytics give you the big picture, these tools from TheBlue.social help you zero in on specific areas like timing, engagement, and accessibility. Here’s a breakdown of what they offer and how they can elevate your performance:
| Tool | Purpose in Optimization |
|---|---|
| Bluesky Network Statistics | Track platform-wide trends to optimize post timing |
| Emoji Stats | Discover which emojis drive the most engagement |
| Generate Hashtags | Create relevant tags to increase visibility |
| Generate Alt Text | Enhance accessibility and improve search rankings |
The Bluesky Network Statistics tool provides real-time insights into activity across the platform. For instance, if data shows peak engagement during evenings in US time zones, you can schedule posts to align with those periods for better visibility. The Emoji Stats tool takes a closer look at your past posts, identifying which emojis resonate most with your audience - whether it’s 🔥 for likes or 😂 for reposts, you can use this information to fine-tune your content.
The Generate Hashtags tool helps you craft trending, relevant tags based on your content, making it easier for new users to discover your posts. This can lead to a noticeable increase in impressions, often ranging from 15-50%. Lastly, the Generate Alt Text tool automatically creates descriptive alt text for your images. Not only does this make your content more accessible for screen readers, but it also improves how your posts rank in Bluesky’s feed, giving you an edge in visibility.
These tools are designed to work seamlessly with your analytics, helping you make smarter, data-driven decisions.
Using Follow-Back and Starter Packs
Growing your audience is as much about engagement as it is about content. Tools like the follow-back feature and browsing starter packs can play a big role in building your network.
The follow-back tool simplifies the process of reciprocating follows, which can organically expand your community. This kind of mutual engagement fosters a sense of connection and can lead to steady audience growth.
Bluesky browsing starter packs are another handy resource. These curated lists introduce you to niche communities and topics, making it easier to engage with like-minded users. By tailoring your posts and hashtags to these communities, you can create content that resonates deeply, driving long-term engagement. Use your analytics dashboard to monitor how these efforts impact your growth and make adjustments as needed.
Conclusion
Final Thoughts on Data-Driven Optimization
Achieving success on Bluesky means understanding your audience through data. Analytics can uncover patterns behind top-performing content, like which emojis work best or the ideal times to post. For instance, posting between 9:00 AM and 12:00 PM EST has been shown to increase reach by 30–50%. By keeping an eye on engagement metrics - replies, reposts, and quotes - over 7-, 30-, and 90-day periods, you can figure out what clicks with your audience and replicate those successes.
The key is experimentation backed by measurement. A/B testing different post formats, timings, and elements allows you to refine your strategy based on actual results, not just guesses. Pair this with accessibility upgrades, such as AI-generated alt text, to make your content more discoverable. Bluesky’s algorithm favors posts that generate high interaction, so aligning your content with these trends ensures better reach. By continuously improving your approach based on real-time data, you create a growth cycle where insights shape strategy, strategy drives engagement, and engagement leads to even deeper insights.
Start Optimizing with TheBlue.social Today
Get started by connecting your Bluesky account to TheBlue.social for real-time analytics. Check out your top posts from the last 30 days and use the activity heatmap to schedule content during peak engagement times.
Take advantage of free tools like Bluesky Network Statistics to track platform-wide trends or My Top 3 Emojis to find out which emojis spark the most engagement. Use the cross-posting scheduler to test different post variations, enable weekly growth reports for a quick performance snapshot, and try the follow-back tool to expand your audience. With TheBlue.social’s free forever plan, you can start analyzing your content in minutes and make smarter, data-driven decisions to boost engagement.
FAQs
What should I track first on Bluesky?
Tracking your engagement metrics - such as likes, replies, reposts, and quotes - is a great way to gauge how well your content connects with your audience. These numbers reveal which posts spark the most interaction, giving you insight into what resonates.
It’s also important to keep an eye on follower growth over time. This helps you see if your audience is expanding and whether your strategy is attracting new people. Once you spot these trends, take a closer look at your post performance. By analyzing this data, you can pinpoint the best times to post and the types of content that drive the most engagement.
How do I find my best posting times?
To figure out the best times to post on Bluesky, try using analytics tools like TheBlue.social. These tools can help you track when your followers are most active by analyzing data like likes, replies, and engagement heatmaps. While general peak periods often include mornings (6–9 AM ET), midday (11 AM–2 PM ET), and evenings (7–10 PM ET), it’s important to tailor your posting schedule based on your audience’s specific activity patterns for better results.
How do I A/B test posts with TheBlue.social?
Want to see what works best for your Bluesky posts? A/B testing can help you figure it out. Here’s how to do it using TheBlue.social:
Create Two Versions of Your Post: Start by making two slightly different versions of your post. You can tweak the content, timing, or even the hashtags to see what resonates more.
Use the Scheduling Tool: With TheBlue.social’s scheduling feature, you can post these versions at different times or target them to different audiences. Timing can play a huge role in engagement, so experiment with it.
Track Performance Metrics: Head to the analytics dashboard to monitor key metrics like likes, replies, and overall engagement rates. This data will give you a clear picture of how each version performed.
Analyze and Refine: Once you’ve gathered enough data, compare the results. Identify which version performed better and use those insights to fine-tune your content strategy moving forward.
Testing like this ensures your posts are more engaging and tailored to your audience’s preferences.
Last updated: May 5, 2026